No Comments

4 Reasons Why Today’s Housing Market is NOT 2006 All Over Again

4 Reasons Why Today’s Housing Market is NOT 2006 All Over Again | Simplifying The Market

With home prices rising again this year, some are concerned that we may be repeating the 2006 housing bubble that caused families so much pain when it collapsed. Today’s market is quite different than the bubble market of twelve years ago. There are four key metrics that explain why:

  1. Home Prices
  2. Mortgage Standards
  3. Mortgage Debt
  4. Housing Affordability

1. HOME PRICES

There is no doubt that home prices have reached 2006 levels in many markets across the country. However, after more than a decade, home prices should be much higher based on inflation alone.

Frank Nothaft is the Chief Economist for CoreLogic (which compiles some of the best data on past, current, and future home prices). Nothaft recently explained:

“Even though CoreLogic’s national home price index got to the same level it was at the prior peak in April of 2006, once you account for inflation over the ensuing 11.5 years, values are still about 18% below where they were.” (emphasis added)

2. MORTGAGE STANDARDS

Some are concerned that banks are once again easing lending standards to a level similar to the one that helped create the last housing bubble. However, there is proof that today’s standards are nowhere near as lenient as they were leading up to the crash.

The Urban Institute’s Housing Finance Policy Center issues a Housing Credit Availability Index (HCAI). According to the Urban Institute:

“The HCAI measures the percentage of home purchase loans that are likely to default—that is, go unpaid for more than 90 days past their due date. A lower HCAI indicates that lenders are unwilling to tolerate defaults and are imposing tighter lending standards, making it harder to get a loan. A higher HCAI indicates that lenders are willing to tolerate defaults and are taking more risks, making it easier to get a loan.”

The graph below reveals that standards today are much tighter on a borrower’s credit situation and have all but eliminated the riskiest loan products.

4 Reasons Why Today’s Housing Market is NOT 2006 All Over Again | Simplifying The Market

3. MORTGAGE DEBT

Back in 2006, many homeowners mistakenly used their homes as ATMs by withdrawing their equity and spending it with no concern for the ramifications. They overloaded themselves with mortgage debt that they couldn’t (or wouldn’t) repay when prices crashed. That is not occurring today.

The best indicator of mortgage debt is the Federal Reserve Board’s household Debt Service Ratio for mortgages, which calculates mortgage debt as a percentage of disposable personal income.

At the height of the bubble market a decade ago, the ratio stood at 7.21%. That meant over 7% of disposable personal income was being spent on mortgage payments. Today, the ratio stands at 4.48% – the lowest level in 38 years!

4. HOUSING AFFORDABILITY

With both house prices and mortgage rates on the rise, there is concern that many buyers may no longer be able to afford a home. However, when we look at the Housing Affordability Index released by the National Association of Realtors, homes are more affordable now than at any other time since 1985 (except for when prices crashed after the bubble popped in 2008).

4 Reasons Why Today’s Housing Market is NOT 2006 All Over Again | Simplifying The Market

Bottom Line

After using four key housing metrics to compare today to 2006, we can see that the current market is not anything like the bubble market.

No Comments

How Much Has Your Home Increased in Value Over the Last Year?

How Much Has Your Home Increased in Value Over the Last Year? | Simplifying The Market

Home values have risen dramatically over the last twelve months. In CoreLogic’s most recent Home Price Index Report, they revealed that national home prices have increased by 6.7% year-over-year.

CoreLogic broke down appreciation even further into four price ranges, giving us a more detailed view than if we had simply looked at the year-over-year increases in national median home price.

The chart below shows the four price ranges from the report, as well as each one’s year-over-year growth from February 2017 to February 2018 (the latest data available).

How Much Has Your Home Increased in Value Over the Last Year? | Simplifying The Market

It is important to pay attention to how prices are changing in your local market. The location of your home is not the only factor that determines how much your home has appreciated over the course of the last year.

Lower-priced homes have appreciated at greater rates than homes at the upper ends of the spectrum due to demand from first-time home buyers and baby boomers looking to downsize.

Bottom Line

If you are planning to list your home for sale in today’s market, let’s get together to go over exactly what’s going on in your area and your price range.

No Comments

Why Home Prices Are Increasing

Why Home Prices Are Increasing | Simplifying The Market

There are many unsubstantiated theories as to why home values are continuing to increase. From those who are worried that lending standards are again becoming too lenient (data shows this is untrue), to those who are concerned that prices are again approaching boom peaks because of “irrational exuberance” (this is also untrue as prices are not at peak levels when they are adjusted for inflation), there seems to be no shortage of opinion.

However, the increase in prices is easily explained by the theory of supply & demand. Whenever there is a limited supply of an item that is in high demand, prices increase.

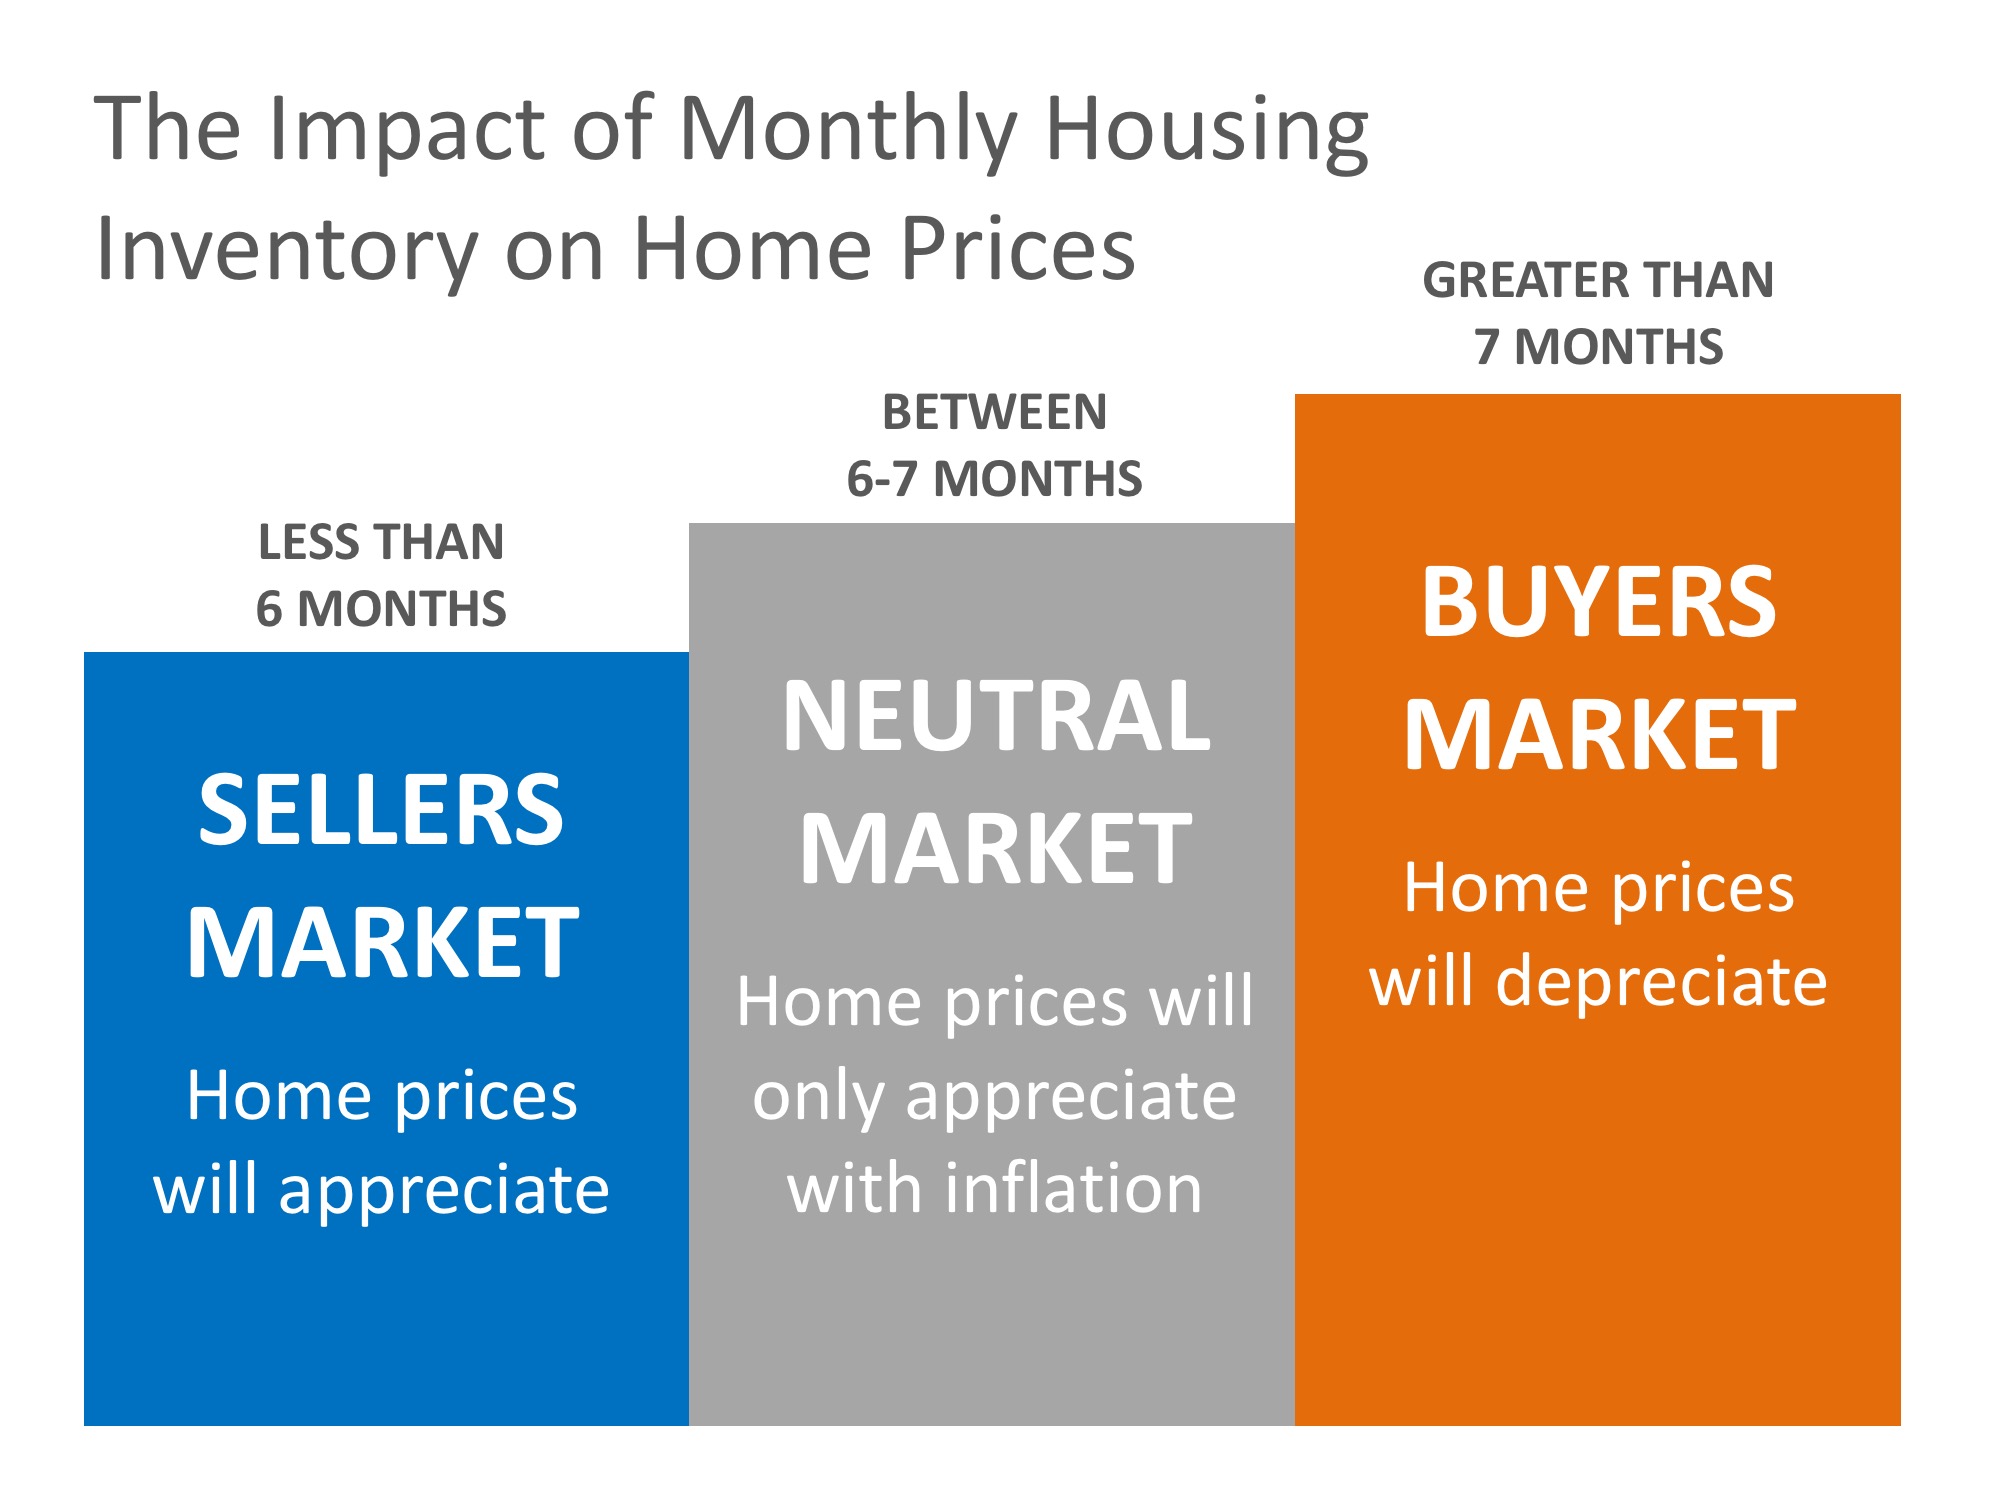
It is that simple. In real estate, it takes a six-month supply of existing salable inventory to maintain pricing stability. In most housing markets, anything less than six months will cause home values to appreciate and anything more than seven months will cause prices to depreciate (see chart below).

Why Home Prices Are Increasing | Simplifying The Market

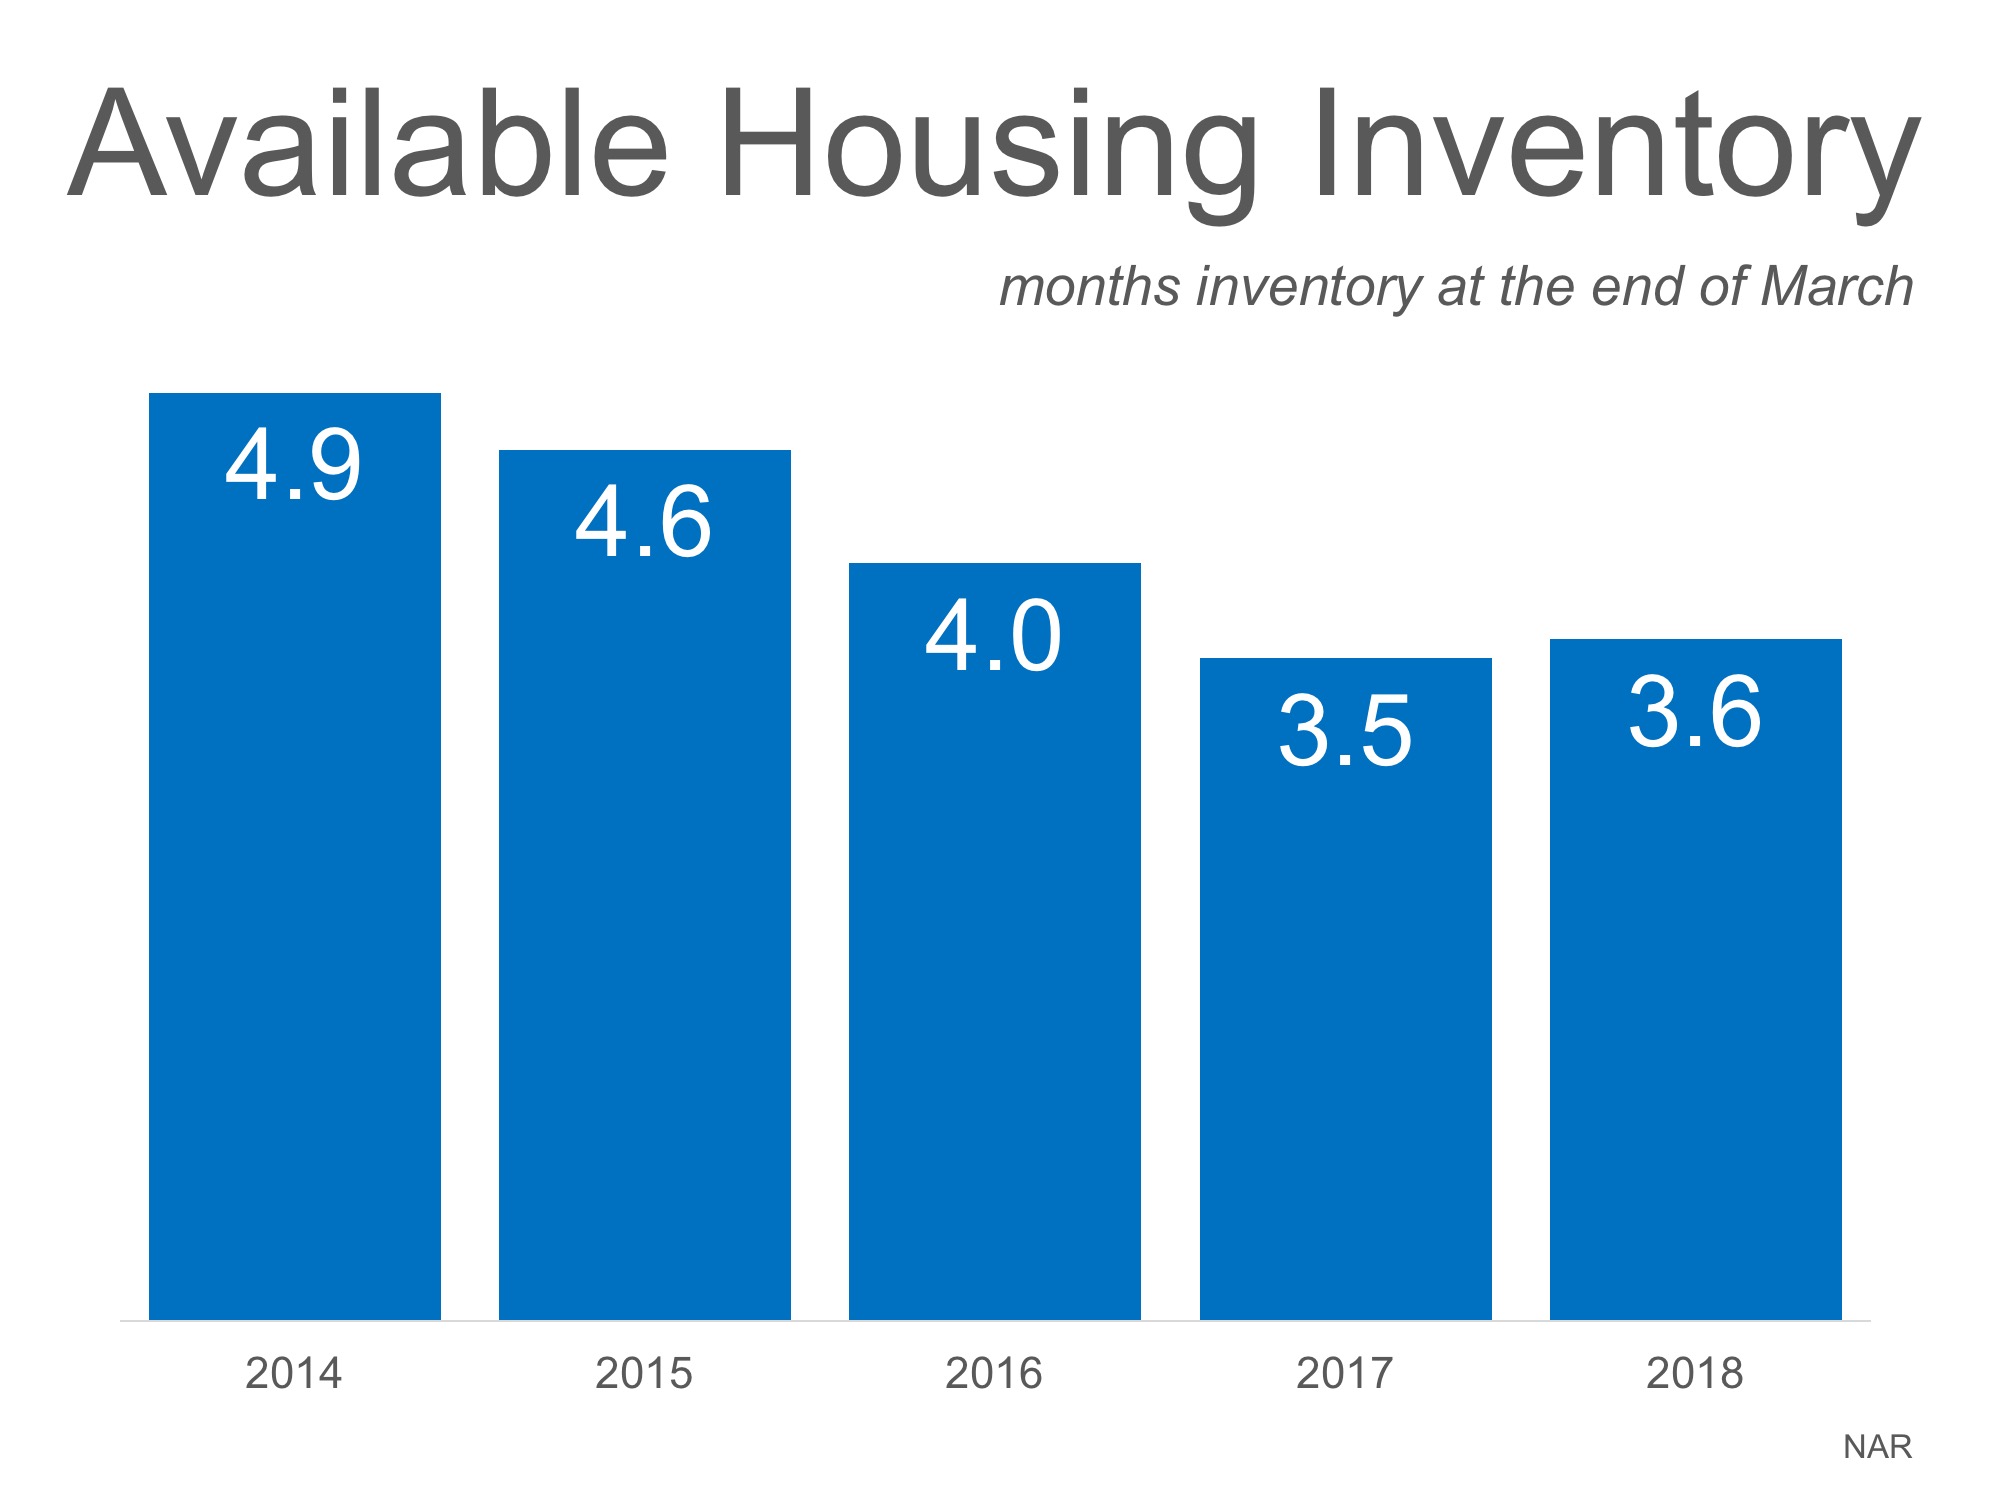
According to the Existing Home Sales Report from the National Association of Realtors (NAR), the monthly inventory of homes for sale has been below six months for the last five years (see chart below).

Why Home Prices Are Increasing | Simplifying The Market

Bottom Line

If buyer demand continues to outpace the current supply of existing homes for sale, prices will continue to appreciate. Nothing nefarious is taking place. It is simply the theory of supply & demand working as it should.

No Comments

Existing Home Sales Grow Despite Low Inventory [INFOGRAPHIC]

Existing Home Sales Grow Despite Low Inventory [INFOGRAPHIC] | Simplifying the Market

Existing Home Sales Grow Despite Low Inventory [INFOGRAPHIC] | Simplifying the Market

Some Highlights:

  • According to the latest Existing Home Sales Report from the National Association of Realtors, sales grew 1.1% in March to an annual pace of 5.60 million.
  • This is the strongest pace since November of 2017.
  • Inventory levels dropped year-over-year for the 34th consecutive month and are now 7.2% lower than March 2017 levels, representing a 3.6-month supply.
No Comments

Buying a Home Is Cheaper Than Renting in the Majority of the US

Buying a Home Is Cheaper Than Renting in the Majority of the US | Simplifying The Market

The results of the 2018 Rental Affordability Report from ATTOM show that buying a median-priced home is more affordable than renting a three-bedroom property in 54% of U.S. counties analyzed for the report.

The updated numbers show that renting a three-bedroom property in the United States requires an average of 38.8% of income.

The least affordable market for renting was Marin County, CA, just over the Golden Gate Bridge from San Francisco, where renters spend a staggering 79.5% of average wages on rent, while the most affordable market was Madison County, AL where 22.3% of average wages went to rent.

Other interesting findings in the report include:

  • Average rent rose faster than income in 60% of counties
  • Average rent rose faster than median home prices in 41% of counties
  • While median home prices rose faster than average rents in 58% of counties

Bottom Line

Buying a home makes sense socially and financially. If you are one of the many renters out there who would like to evaluate your ability to buy this year, let’s get together to find your dream home.

No Comments

A Tale of Two Markets [INFOGRAPHIC]

A Tale of Two Markets [INFOGRAPHIC] | Simplifying The Market 

Some Highlights:

  • A trend that has been emerging for some time now is the contrast between inventory & demand in the Premium & Luxury Markets vs. the Starter & Trade-Up Home Markets and what that’s, in turn, doing to prices!
  • Inventory continues to rise in the luxury & premium home markets which is causing prices to cool.
  • Demand continues to rise with low inventory in the starter & trade-up home markets, causing prices to rise!
No Comments

House Prices: Simply a Matter of Supply & Demand

House Prices: Simply a Matter of Supply & Demand | Simplifying The Market

Why are home prices still rising? It is a simple answer. There are more purchasers in the market right now than there are available homes for them to buy. This is an example of the theory of “supply and demand” which is defined as:

“the amount of a commodity, product, or service available and the desire of buyers for it, considered as factors regulating its price.”

When demand exceeds supply, prices go up. This is currently happening in the residential real estate market.

Here are the numbers for supply and demand as compared to last year for the last three months (March numbers are not yet available):

House Prices: Simply a Matter of Supply & Demand | Simplifying The Market

In each of the last three months, demand (buyer traffic) has increased as compared to last year while supply (number of available listings) has decreased. If this situation persists, home values will continue to increase.

Bottom Line

The reason home prices are still rising is because there are many purchasers looking to buy, but very few homeowners ready to sell. This imbalance is the reason prices will remain on the uptick.

No Comments

99% of Experts Agree: Home Prices Will Increase

99% of Experts Agree: Home Prices Will Increase | Simplifying The Market

Some believe that the combined effects of the new tax code and rising mortgage rates will have an adverse impact on residential real estate prices in 2018. However, the clear majority of recently surveyed housing experts believe that home values will continue to rise this year.

What is the Home Price Expectation Survey?

Each quarter, Pulsenomics surveys a nationwide panel of economists, real estate experts and investment & market strategists. Those surveyed include experts such as:

  • Daniel Bachman, Senior Manager, U.S. Economics at Deloitte Services, LP
  • Kathy Bostjancic, Head of U.S. Macro Investors Service at Oxford Economics
  • David Downs, Real Estate Finance Professor at VCU
  • Edward Pinto, Resident Fellow at American Enterprise Institute
  • Albert Saiz, Director at MIT Center for Real Estate

Where do these experts see home values headed in 2018?

Here is a breakdown of where they see home values twelve months from now:

  • 21.6% believe prices will appreciate by 6% or more
  • 71.6% believe prices will appreciate between 3 and 5.99%
  • 5.7% believe prices will appreciate between 0 and 2.99%
  • Only 1.1% believe prices will depreciate

Bottom Line

Almost ninety-nine percent of the top experts studying residential real estate believe that prices will appreciate this year, and over 93% believe home values will appreciate by at least 3%.

No Comments

Freddie Mac: Rising Mortgage Rates DO NOT Lead to Falling Home Prices

Freddie Mac: Rising Mortgage Rates DO NOT Lead to Falling Home Prices | Simplifying The Market

Recently, Freddie Mac published an Insight Report titled Nowhere to go but up? How increasing mortgage rates could affect housing. The report focused on the impact the projected rise in mortgage rates might have on the housing market this year.

Many believe that an increase in mortgage rates will cause a slowdown in purchases which would, in turn, lead to a fall in house values. Ultimately, however, prices are determined by supply and demand and while rising mortgage rates may slow demand, they also affect supply. From the report:

 “For current homeowners, the decision to buy a new home is typically linked to their decision to sell their current home… Because of this link, the financing costs of the existing mortgage are part of the homeowner’s decision of whether and when to move.

Once financing costs for a new mortgage rise above the rate borrowers are paying for their current mortgage, borrowers would have to give up below-market financing to sell their home.

Instead, they may choose to delay both the sale of their existing home and the purchase of a new home to maintain the advantageous financing.”

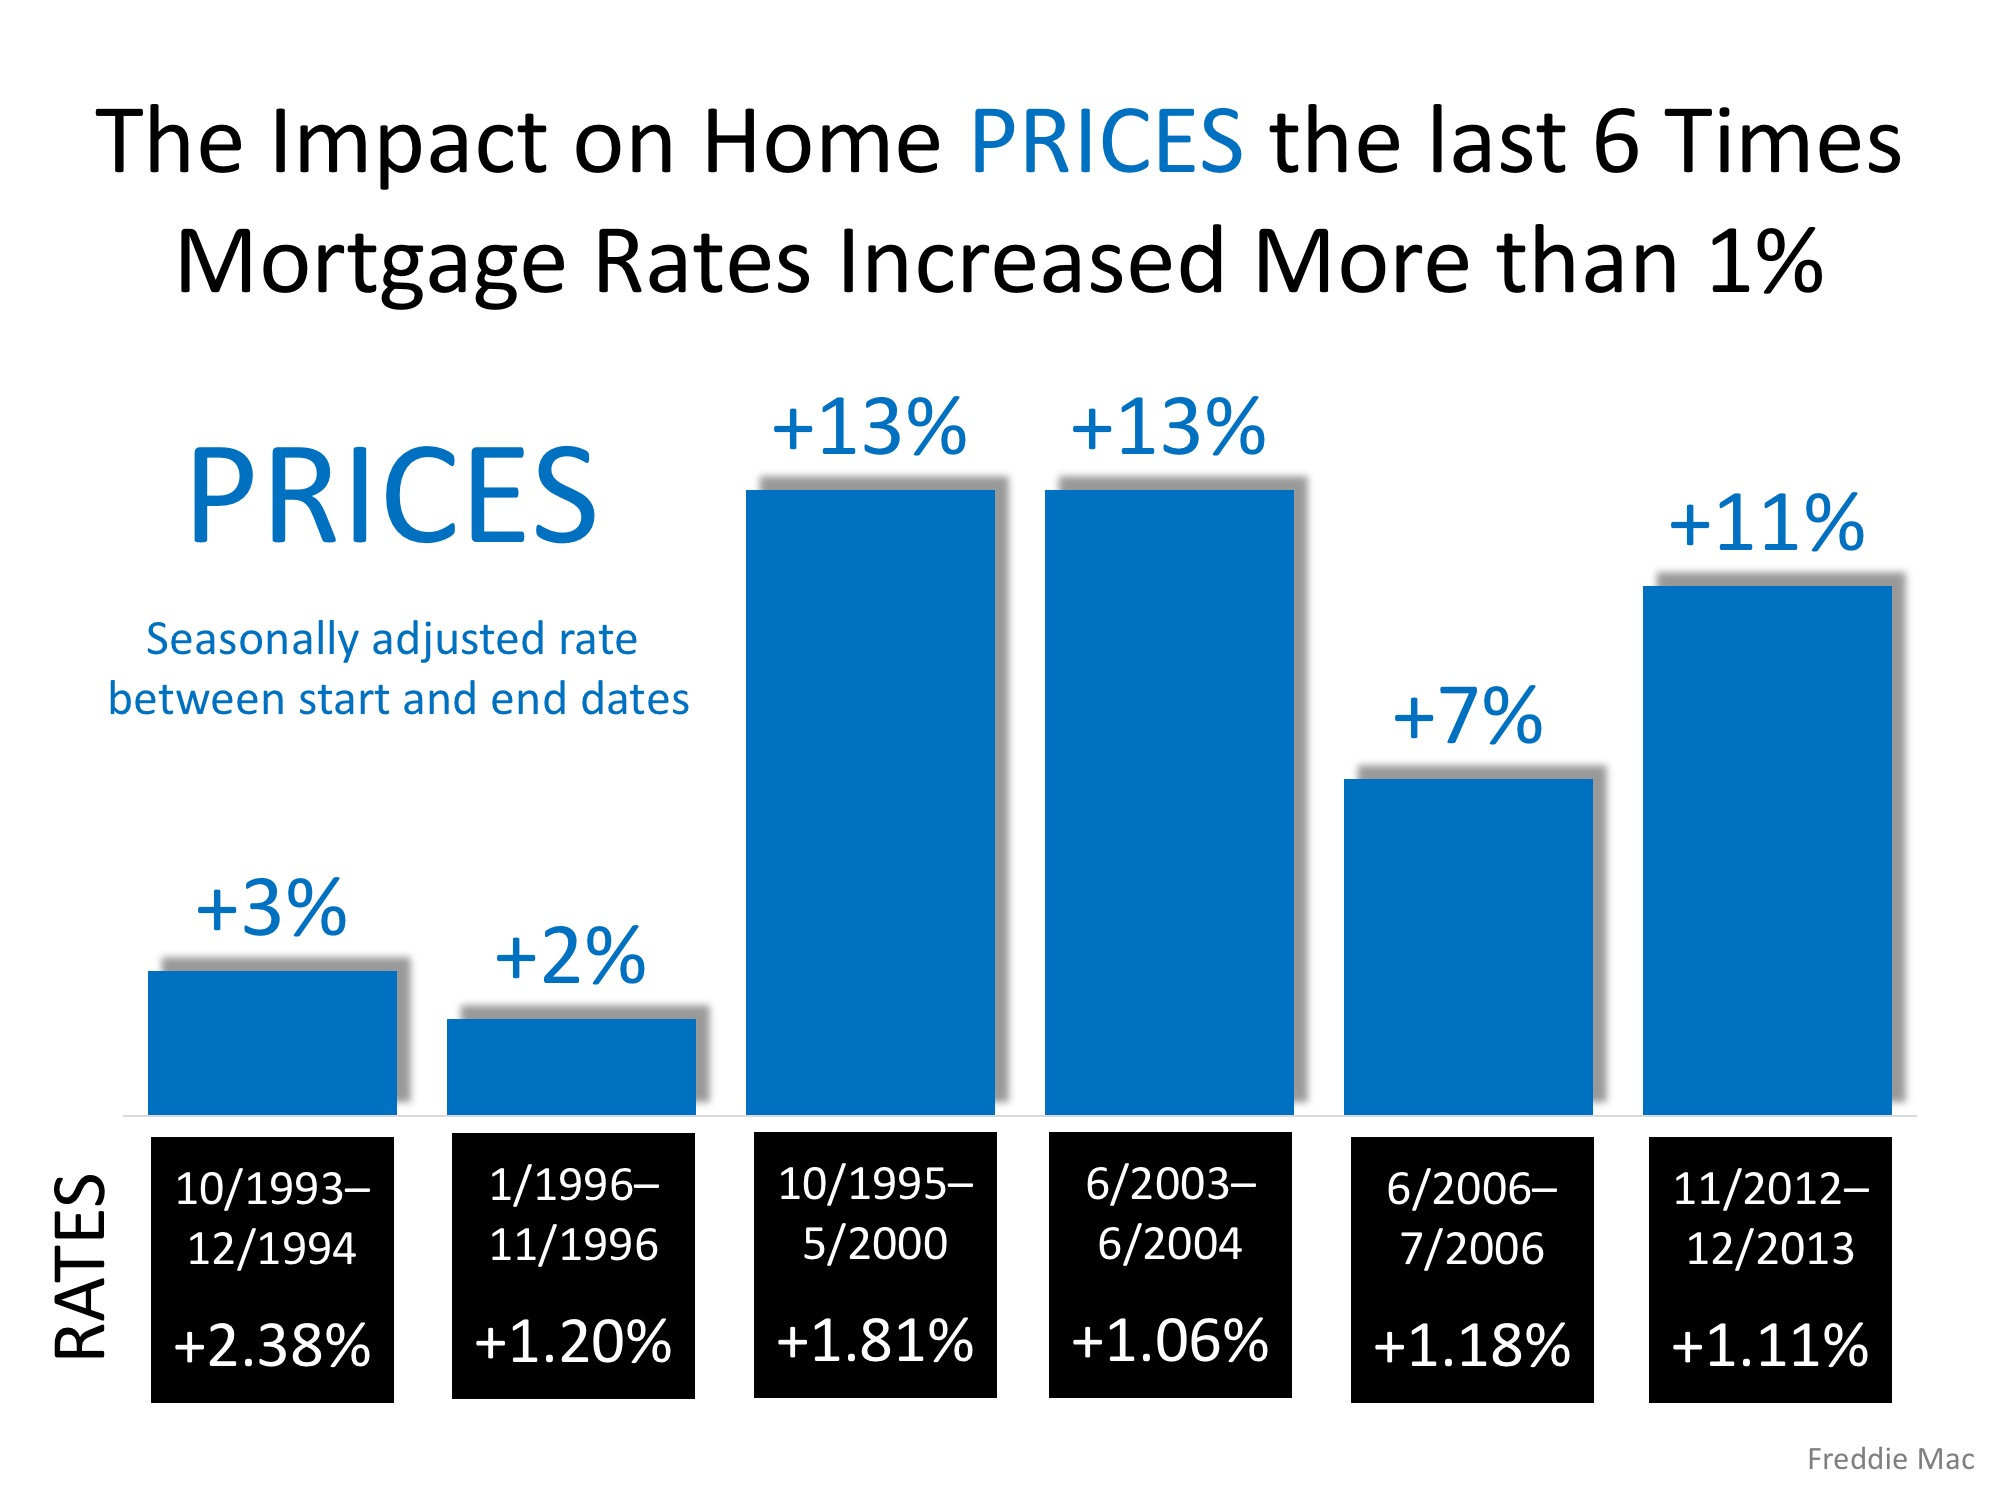
The Freddie Mac report, in acknowledging this situation, concluded that prices are not adversely impacted by higher mortgage rates. They explained:

“While there is a drop in the demand for homes, there is an associated drop in the supply of homes from the link between the selling and buying decisions. As both supply and demand move together in this way they have offsetting effects on price—lower demand decreases price and lower supply increases price.

They went on to reveal that the Freddie Mac National House Price Index is…

“…unresponsive to movements in interest rates. In the current housing market, the driving force behind the increase in prices is a low supply of both new and existing homes combined with historically low rates. As mortgage rates increase, the demand for home purchases will likely remain strong relative to the constrained supply and continue to put upward pressure on home prices.”

The following graph, based on data from the report, reveals what happened to home prices the last six times mortgage rates rose by at least 1%.

Freddie Mac: Rising Mortgage Rates DO NOT Lead to Falling Home Prices | Simplifying The Market

Bottom Line

Whether you are a move-up buyer or first-time buyer, waiting to purchase your next home based on the belief that prices will fall because of rising mortgage rates makes no sense.