No Comments

The #1 Reason to Put Your House on The Market TODAY!

The #1 Reason to Put Your House on The Market TODAY! | Simplifying The Market

The National Association of Realtors (NAR) released the results of their latest Existing Home Sales Report which revealed that home sales declined 0.6% to a seasonally adjusted annual rate of 5.38 million in June from 5.41 million in May, and are 2.2% below a year ago. Some may look at these numbers and think that now is a bad time to sell their house, but in fact, the opposite is true.

The national slowdown in sales is directly tied to a lack of inventory available for the buyers who are out in the market looking for their dream homes! In fact, the inventory of homes for sale had fallen year-over-year for 36 consecutive months before posting a modest 0.5% gain last month and has had an upward impact on home prices.

NAR’s Chief Economist Lawrence Yun had this to say,

“It’s important to note that despite the modest year-over-year rise in inventory, the current level is far from what’s needed to satisfy demand levels. Furthermore, it remains to be seen if this modest increase will stick, given the fact that the robust economy is bringing more interested buyers into the market, and new home construction is failing to keep up.”

The few houses that are on the market are selling fast! According to NAR’s Realtors Confidence Index, properties were typically on the market for 26 days.

Bottom Line

If you are one of the many homeowners who is debating listing your house for sale this year, the time is now! Let’s get together to discuss the specifics of our market!

No Comments

4 Reasons Why We Are Not Heading Toward Another Housing Bubble

4 Reasons Why We Are Not Heading Toward Another Housing Bubble | Simplifying The Market

With home prices continuing to appreciate above historic levels, some are concerned that we may be heading for another housing ‘boom & bust.’ It is important to remember, however, that today’s market is quite different than the bubble market of twelve years ago.

Here are four key metrics that will explain why:

  1. Home Prices
  2. Mortgage Standards
  3. Foreclosure Rates
  4. Housing Affordability

1. HOME PRICES

There is no doubt that home prices have reached 2006 levels in many markets across the country. However, after more than a decade, home prices should be much higher based on inflation alone.

Last week, CoreLogic reported that,

“The inflation-adjusted U.S. median sale price in June 2006 was $247,110 (or $199,899 in 2006 dollars), compared with $213,400 in March 2018.” (This is the latest data available.)

2. MORTGAGE STANDARDS

Many are concerned that lending institutions are again easing standards to a level that helped create the last housing bubble. However, there is proof that today’s standards are nowhere near as lenient as they were leading up to the crash.

The Urban Institute’s Housing Finance Policy Center issues a monthly index which,

“…measures the percentage of home purchase loans that are likely to default—that is, go unpaid for more than 90 days past their due date. A lower HCAI indicates that lenders are unwilling to tolerate defaults and are imposing tighter lending standards, making it harder to get a loan. A higher HCAI indicates that lenders are willing to tolerate defaults and are taking more risks, making it easier to get a loan.”

Their July Housing Credit Availability Index revealed:

“Significant space remains to safely expand the credit box. If the current default risk was doubled across all channels, risk would still be well within the pre-crisis standard of 12.5 percent from 2001 to 2003 for the whole mortgage market.”

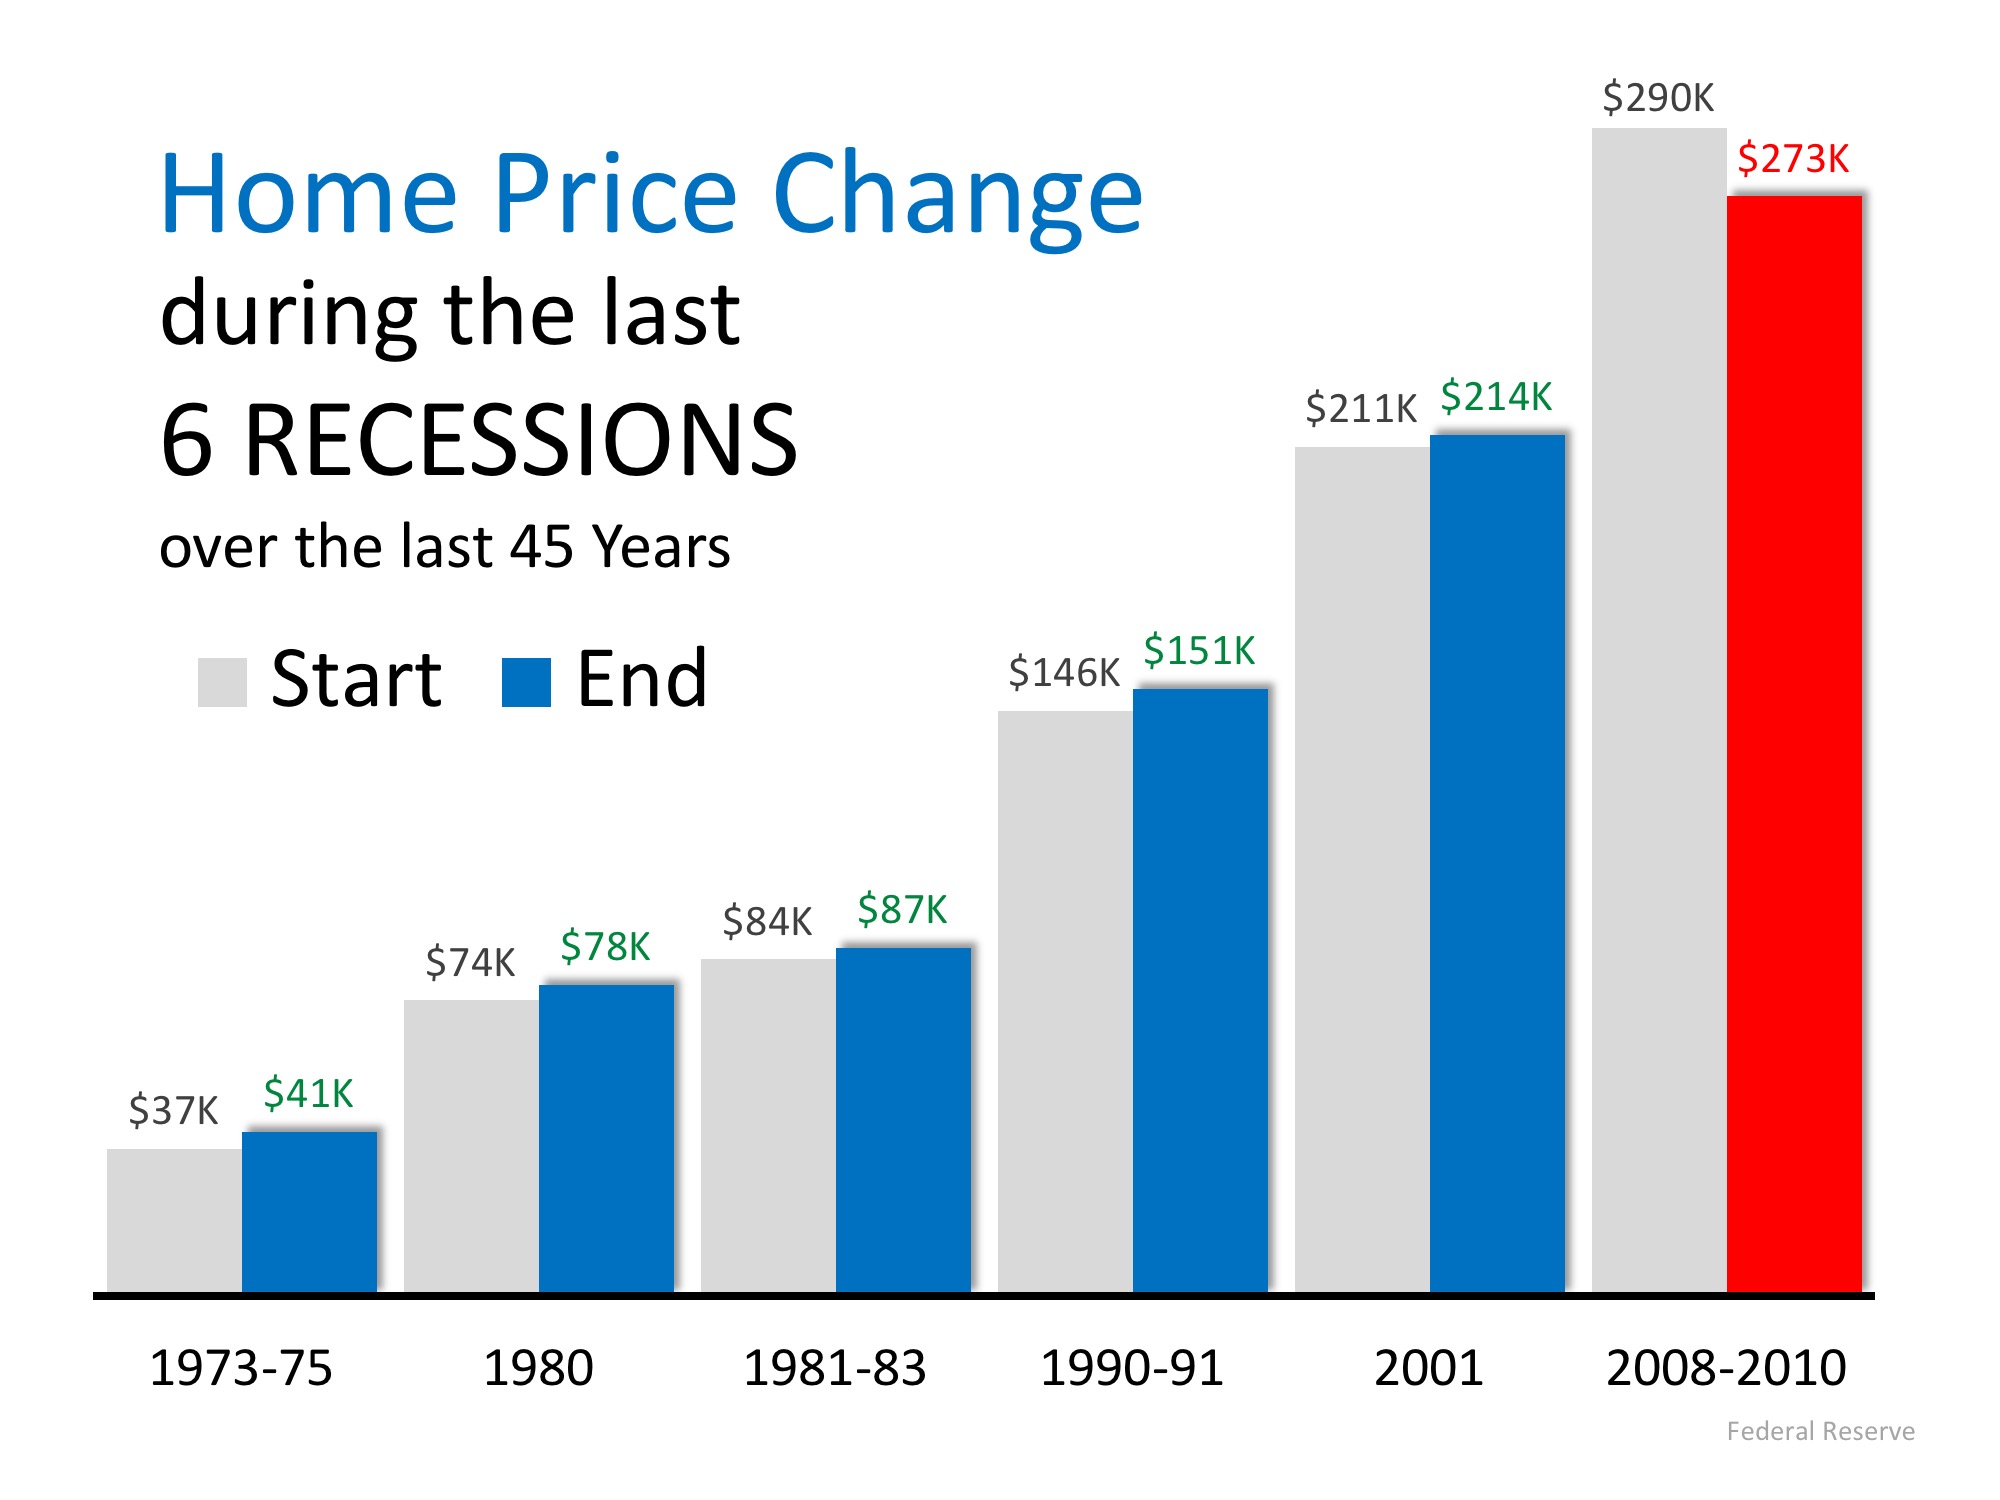
3. FORECLOSURE RATES

A major cause of the housing crash last decade was the number of foreclosures that hit the market. They not only increased the supply of homes for sale but were also being sold at 20-50% discounts. Foreclosures helped drive down all home values.

Today, foreclosure numbers are lower than they were before the housing boom. Here are the number of consumers with new foreclosures according to the Federal Reserve’s most recent Household Debt and Credit Report:

  • 2003: 203,320 (earliest reported numbers)
  • 2009: 566,180 (at the valley of the crash)
  • Today: 76,480

Foreclosures today are less than 40% of what they were in 2003.

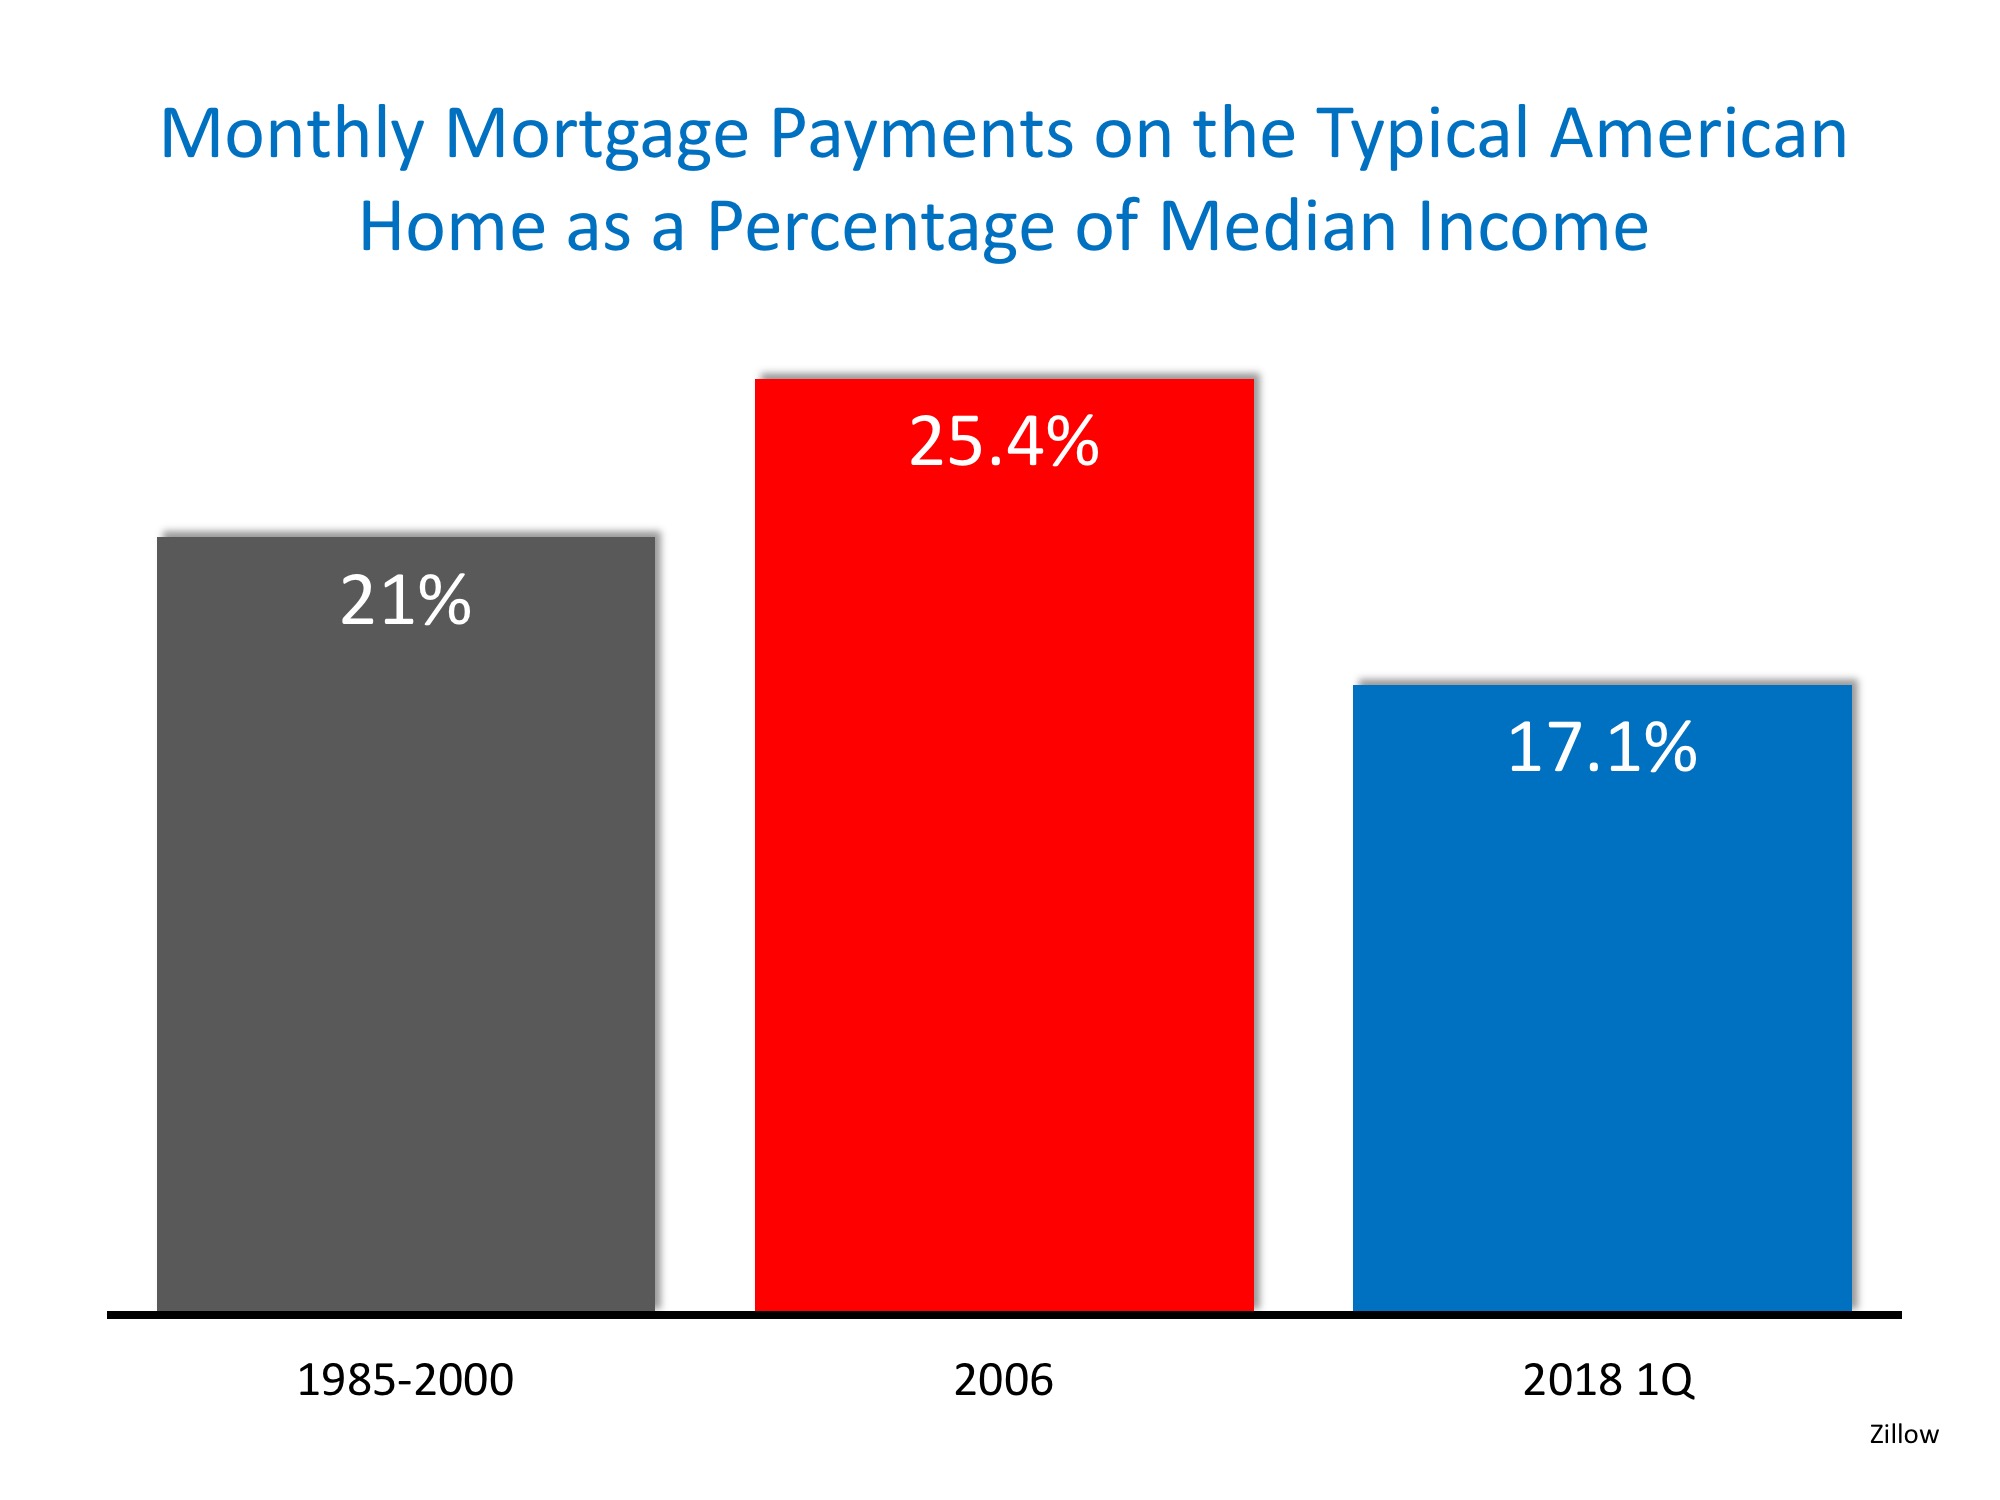
4. HOUSING AFFORDABILITY

Contrary to many headlines, home affordability is better now than it was prior to the last housing boom. In the same article referenced in #1, CoreLogic revealed that in the vast majority of markets, “the inflation-adjusted, principal-and-interest mortgage payments that homebuyers have committed to this year remain much lower than their pre-crisis peaks.”

They went on to explain:

“The main reason the typical mortgage payment remains well below record levels in most of the country is that the average mortgage rate back in June 2006, when the U.S. typical mortgage payment peaked, was about 6.7 percent, compared with an average mortgage rate of about 4.4 percent in March 2018.”

The “price” of a home may be higher, but the “cost” is still below historic norms.

Bottom Line

After using these four key housing metrics to compare today to last decade, we can see that the current market is not anything like that bubble market.

No Comments

Lack of Listings Slowing Down the Market

Lack of Listings Slowing Down the Market | Simplifying The Market

As the real estate market continues to move down the road to a complete recovery, we see home values and home sales increasing while distressed sales (foreclosures and short sales) continue to fall to their lowest points in years. There is no doubt that the housing market will continue to strengthen throughout 2018.

However, there is one thing that may cause the industry to tap the brakes: a lack of housing inventory!

Here’s what a few industry experts have to say about the current inventory crisis:

Lawrence Yun, Chief Economist for the National Association of Realtors

“Inventory coming onto the market during this year’s spring buying season…was not even close to being enough to satisfy demand, that is why home prices keep outpacing incomes and listings are going under contract in less than a month – and much faster – in many parts of the country.”

Sam Khater, Chief Economist for Freddie Mac

“While this spring’s sudden rise in mortgage rates [took] up a good chunk of the conversation, it’s the stubbornly low inventory levels in much of the country that are preventing sales from really taking off like they should… Most markets simply need a lot more new and existing supply to cool price growth and give buyers enough choices.”

Alexandra Lee, Housing Data Analyst for Trulia

This seasonal inventory jump wasn’t enough to offset the historical year-over-year downward trend that has continued over 14 consecutive quarters…Despite the second-quarter gain, inventory was down 5.3% from a year ago. Still, this represents an easing of the double-digit drops we’ve been seeing since the second quarter of 2017.”

Bottom Line

If you are thinking about selling, now may be the time. Demand for your house will be strongest while there is still very little competition which could lead to a quick sale for a great price.

No Comments

Housing Will Not Fall Victim to Next Economic Storm

Housing Will Not Fall Victim to Next Economic Storm | Simplifying The Market

Some experts are calling for a slowdown in the economy later this year and most economists have predicted that the next recession could only be eighteen months away. The question is, what impact will a recession have on the housing market?

Here are the opinions of several experts on the subject:

Ivy Zelman in her latest “Z Report”:

“While economic activity appears to have accelerated so far in 2018, some prominent economic forecasters have become more cautious about growth prospects for 2019 and 2020…

All told, while solid long-term demographic underpinnings support our positive fundamental outlook for housing, in the event micro-economic headwinds surface, we would expect housing transaction volumes and home prices to weather the storm.”

Aaron Terrazas, Zillow’s Senior Economist:

“While much remains unknown about the precise path of the U.S. economy in the years ahead, another housing market crisis is unlikely to be a central protagonist in the next nationwide downturn.”

Mark Fleming, First American’s Chief Economist:

“If a recession is to occur, it is unlikely to be caused by housing-related activity, and therefore the housing sector should be one of the leading sources to come out of the recession.”

Mark J. Hulbert, Financial Analyst and Journalist:

“Real estate may be one of your best investments during the next bear market for stocks. And by real estate, I mean your home or other residential properties.”

U.S. News and World Report:

“Fortunately – and hopefully – the history of recessions and current issues that could harm the economy don’t lead many to believe the housing market crash will repeat itself in an upcoming decline.”

No Comments

How Long Do Most Families Live in a House?

How Long Do Most Families Live in a House? | Simplifying The Market

The National Association of Realtors (NAR) keeps historical data on many aspects of homeownership. One of their data points, which has changed dramatically, is the median tenure of a family in a home, meaning how long a family stays in a home prior to moving.

As the graph below shows, over the last twenty years (1985-2008), the median tenure averaged exactly six years. However, since 2014, that average is almost ten years – an increase of almost 50%.

How Long Do Most Families Live in a House? | Simplifying The Market

Why the dramatic increase?

The reasons for this change are plentiful!

The fall in home prices during the housing crisis left many homeowners in a negative equity situation (where their home was worth less than the mortgage on the property). Also, the uncertainty of the economy made some homeowners much more fiscally conservative about making a move.

With home prices rising dramatically over the last several years, 95.3% of homes with a mortgage are now in a positive equity situationaccording to CoreLogic.

With the economy coming back and wages starting to increase, many homeowners are in a much better financial situation than they were just a few short years ago.

One other reason for the increase was brought to light by NAR in their 2018 Home Buyer and Seller Generational Trends Report. According to the report,

“Sellers 37 years and younger stayed in their home for six years…”

These homeowners, who are either looking for more space to accommodate their growing families or for better school districts to do the same, are likely to move more often (compared to typical sellers who stayed in their homes for 10 years). The homeownership rate among young families, however, has still not caught up to previous generations, resulting in the jump we have seen in median tenure!

What does this mean for housing?

Many believe that a large portion of homeowners are not in a house that is best for their current family circumstance; they could be baby boomers living in an empty, four-bedroom colonial, or a millennial couple living in a one-bedroom condo planning to start a family.

These homeowners are ready to make a move, and since a lack of housing inventory is still a major challenge in the current housing market, this could be great news.

No Comments

The #1 Reason to List Your House for Sale NOW!

The #1 Reason to List Your House for Sale NOW! | Simplifying The Market

If you are debating whether or not to list your house for sale this year, here is the #1 reason not to wait!

Buyer Demand Continues to Outpace the Supply of Homes for Sale

The National Association of Realtors’ (NAR) Chief Economist Lawrence Yun recently commented on the current lack of inventory:

“Inventory coming onto the market during this year’s spring buying season – as evidenced again by last month’s weak reading – was not even close to being enough to satisfy demand. 

That is why home prices keep outpacing incomes and listings are going under contract in less than a month – and much faster – in many parts of the country.”

The latest Existing Home Sales Report shows that there is currently a 4.1-month supply of homes for sale. This remains lower than the 6-month supply necessary for a normal market, and 6.1% lower than last year’s inventory level.

The chart below details the year-over-year inventory shortages experienced over the last 12 months:

The #1 Reason to List Your House for Sale NOW! | Simplifying The Market

Anything less than a six-month supply is considered a “seller’s market.”

Bottom Line

Let’s get together to discuss the supply conditions in our neighborhood so that I can assist you in gaining access to the buyers who are ready, willing, and able to buy right now!

No Comments

Homes More Affordable Today than 1985-2000

Homes More Affordable Today than 1985-2000 | Simplifying The Market

Rising home prices have many concerned that the average family will no longer be able to afford the most precious piece of the American Dream – their own home.

However, it is not just the price of a home that determines its affordability. The monthly cost of a home is determined by the price and the interest rate on the mortgage used to purchase it.

Today, mortgage interest rates stand at about 4.5%. The average annual mortgage interest rate from 1985 to 2000 was almost double that number, at 8.92%. When comparing affordability of homeownership over the decades, we must also realize that incomes have increased.

This is why most indexes use the percentage of median income required to make monthly mortgage payments on a typical home as the point of comparison.

Zillow recently released a report comparing home affordability over the decades using this formula. The report revealed that, though homes are less affordable this year than last year, they are more affordable today (17.1%) than they were between 1985-2000 (21%). Additionally, homes are more affordable now than at the peak of the housing bubble in 2006 (25.4%). Here is a chart of these findings:

Homes More Affordable Today than 1985-2000 | Simplifying The Market

What will happen when mortgage interest rates rise?

Most experts think that the mortgage interest rate will increase to about 5% by year’s end. How will that impact affordability? Zillow also covered this in their report:

Homes More Affordable Today than 1985-2000 | Simplifying The Market

Rates would need to approach 6% before homes became less affordable than they had been historically.

Bottom Line

Though homes are less affordable today than they were last year, they are still a great purchase while interest rates are below the 6% mark.

No Comments

Buying This Summer? Be Prepared for Bidding Wars

Buying This Summer? Be Prepared for Bidding Wars | Simplifying The Market

Summer is traditionally a busy season for real estate. Buyers come out in force and homeowners list their houses for sale hoping to capitalize on those buyers who are looking to purchase before the new school year. This year will be no different!

Buyers have already been out in force looking for their dream homes and more are on their way. The challenge is that the inventory of homes for sale has not kept up with demand, which has led to A LOT of competition for the homes that are available.

A recent article by the National Association of Realtors touched on the current market conditions:

“Realtors® in areas with strong job markets report that consumer frustration is rising. Home shoppers are increasingly struggling to find an affordable property to buy, and the prevalence of multiple bids is pushing prices further out of reach.”

Realtor.com went on to explain why buyers are flocking to the market in such big numbers:

“A booming economy and stable employment in most parts of the country have created a new generation of eager home buyers – and led to fevered price battles spilling over into some unexpected, smaller markets.”

Javier Vivas, Director of Economic Research for Realtor.com had this to say about competition:

Multiple-offer scenarios are no longer reserved to the usual big, fast-moving markets…demand for homes has spilled outward into secondary, smaller markets, and more buyers are gearing up to face fierce competition in more places around the country.”

Realtor.com looked at the number of homes that were selling above asking price to determine which markets were heating up. Below are the Top 10:

  • Akron, OH
  • Worcester, MA
  • Lexington, KY
  • Irvine, CA
  • Greensboro, NC
  • Sioux Falls, SD
  • Madison, WI
  • Louisville, KY
  • Tacoma, WA
  • Little Rock, AR

Bottom Line

Let’s get together to discuss our exact market conditions so that we can help you create a strategy to secure your new home in this competitive atmosphere!

No Comments

Next Recession in 2020? What Will Be the Impact?

Next Recession in 2020? What Will Be the Impact? | Simplifying The Market

Economists and analysts know that the country has experienced economic growth for almost a decade. They also know that a recession can’t be too far off. A recent report by Zillow Research shed light on a survey conducted by Pulsenomics in which they asked economists, investment strategists and market analysts how they felt about the current housing market. That report revealed the possible timing of the next recession:

Experts largely expect the next recession to begin in 2020.”

That timing concurs with a recent survey of economists by the Wall Street Journal:

“The economic expansion that began in mid-2009 and already ranks as the second-longest in American history most likely will end in 2020 as the Federal Reserve raises interest rates to cool off an overheating economy, according to forecasters surveyed.”

Here is a graph comparing the opinions of those surveyed by both the Wall Street Journal and Pulsenomics:

Next Recession in 2020? What Will Be the Impact? | Simplifying The Market

Recession DOES NOT Equal Housing Crisis

According to the Merriam-Webster Dictionary, a recession is defined as follows:

“A period of temporary economic decline during which trade and industrial activity are reduced, generally identified by a fall in GDP in two successive quarters.”

A recession means the economy has slowed down markedly. It does not mean we are experiencing another housing crisis. Obviously, the housing crash of 2008 caused the last recession. However, during the previous five recessions home values appreciated.

Next Recession in 2020? What Will Be the Impact? | Simplifying The Market

According to the experts surveyed by Pulsenomics, the top three probable triggers for the next recession are:

  • Monetary policy
  • Trade policy
  • A stock market correction

A housing market correction was ranked ninth in probability. Those same experts also projected that home values would continue to appreciate in 2019, 2020, 2021 and 2022.  

Others agree that housing will not be impacted like it was a decade ago.

Mark Fleming, First American’s Chief Economist, explained:

“If a recession is to occur, it is unlikely to be caused by housing-related activity, and therefore the housing sector should be one of the leading sources to come out of the recession.”

And U.S. News and World Report agreed:

“Fortunately – and hopefully – the history of recessions and current issues that could harm the economy don’t lead many to believe the housing market crash will repeat itself in an upcoming decline.”

Bottom Line

A recession is probably less than two years away. A housing crisis is not.