No Comments

Will Home Prices Continue to Increase?

Will Home Prices Continue to Increase? | Simplifying The Market

There are many unsubstantiated theories about what is happening with home prices. From those who are worried that prices are falling (data shows this is untrue), to those who are concerned that prices are again approaching boom peaks because of “irrational exuberance” (this is also untrue as prices are not at peak levels when they are adjusted for inflation), there seems to be no shortage of opinion.

However, the increase in prices is easily explained by the theory of supply & demand. Whenever there is a limited supply of an item that is in high demand, prices increase. It is that simple. In real estate, it takes a six-month supply of existing salable inventory to maintain pricing stability. In most housing markets, anything less than six months will cause home values to appreciate and anything greater than seven months will cause prices to depreciate (see chart below).

Will Home Prices Continue to Increase? | Simplifying The Market

According to the Existing Home Sales Report from the National Association of Realtors (NAR), the monthly inventory of homes for sale has been below six months for the last five years (see chart below).

Will Home Prices Continue to Increase? | Simplifying The Market

Bottom Line

If buyer demand continues to outpace the current supply of existing homes for sale, prices will continue to appreciate. Nothing nefarious is taking place. It is simply the theory of supply & demand working as it should.

No Comments

New Home Sales Up 12.7% From Last Year

New Home Sales Up 12.7% From Last Year | Simplifying The Market

According to the latest New Residential Sales Report from the Census Bureau, new construction sales in August were up 3.5% from July and 12.7% from last year! This marks the second consecutive month with double-digit year-over-year growth (12.8% in July).

The report also showed that builders have ramped up construction with an increase in new construction starts and completions. The summer months are often a busy time for builders as they capitalize on the warmer weather to be able to finish projects.

Below is a table showing the change in starts, completions, and sales from last August.

New Home Sales Up 12.7% From Last Year | Simplifying The Market

Other notable news from the report is that the percentage of new construction sales in the $200-$299k range has continued to break away from the $300-$399k range.

This shows that builders are starting to build lower-priced homes that will help alleviate some of the inventory challenges in the starter and trade-up home categories. The chart below shows the full breakdown.

New Home Sales Up 12.7% From Last Year | Simplifying The Market

What does this mean for buyers and sellers?

If you are thinking of buying or selling in today’s market, you no doubt have heard that there is a shortage of existing homes for sale which has been driving home prices up across the country. The additional new construction coming to the market could help alleviate this shortage, but we are still not back up to pre-crisis levels.

No Comments

What’s Going On With Home Prices?

What’s Going On With Home Prices? | Simplifying The Market

According to CoreLogic’s latest Home Price Insights Report, national home prices in August were up 5.5% from August 2017. This marks the first time since June 2016 that home prices did not appreciate by at least 6.0% year-over-year.

CoreLogic’s Chief Economist Frank Nothaft gave some insight into this change,

“The rise in mortgage rates this summer to their highest level in seven years has made it more difficult for potential buyers to afford a home. The slackening in demand is reflected in the slowing of national appreciation, as illustrated in the CoreLogic Home Price Index.  

National appreciation in August was the slowest in nearly two years, and we expect appreciation to slow further in the coming year.”

One of the major factors that has driven prices to accelerate at a pace of between 6-7% over the past two years was the lack of inventory available for sale in many areas of the country. This made houses a prized commodity which forced many buyers into bidding wars and drove prices even higher.

According to the National Association of Realtors’ (NAR) latest Existing Home Sales Report, we are starting to see more inventory come to market over the last few months. This, paired with patient buyers who are willing to wait to find the right homes, is creating a natural environment for price growth to slow.

Historically, prices appreciated at a rate of 3.7% (from 1987-1999). CoreLogic predicts that prices will continue to rise over the next year at a rate of 4.7%.

Bottom Line

As the housing market moves closer to a ‘normal market’ with more inventory for buyers to choose from, home prices will start to appreciate at a more ‘normal’ level, and that’s ok! If you are curious about home prices in your area, let’s get together to chat about what’s going on!

No Comments

2 Factors to Watch in Today’s Real Estate Market Whether Buying or Selling

2 Factors to Watch in Today’s Real Estate Market Whether Buying or Selling | Simplifying The Market

When it comes to buying or selling a home there are many factors you should consider. Where you want to live, why you want to buy or sell, and who will help you along your journey are just some of those factors. When it comes to today’s real estate market, though, the top two factors to consider are what’s happening with interest rates & inventory.

Interest Rates

Mortgage interest rates have been on the rise and are now over three-quarters of a percentage point higher than they were at the beginning of the year. According to Freddie Mac’s latest Primary Mortgage Market Survey, rates climbed to 4.72% for a 30-year fixed rate mortgage last week.

The interest rate you secure when buying a home not only greatly impacts your monthly housing costs, but also impacts your purchasing power.

Purchasing power, simply put, is the amount of home you can afford to buy for the budget you have available to spend. As rates increase, the price of the house you can afford to buy will decrease if you plan to stay within a certain monthly housing budget.

The chart below shows the impact that rising interest rates would have if you planned to purchase a $400,000 home while keeping your principal and interest payments between $2,020-$2,050 a month.

2 Factors to Watch in Today’s Real Estate Market Whether Buying or Selling | Simplifying The Market

With each quarter of a percent increase in interest rate, the value of the home you can afford decreases by 2.5% (in this example, $10,000). Experts predict that mortgage rates will be over 5% by this time next year.

Inventory

A ‘normal’ real estate market requires there to be a 6-month supply of homes for sale in order for prices to increase only with inflation. According to the National Association of Realtors (NAR), listing inventory is currently at a 4.3-month supply (still well below the 6-months needed), which has put upward pressure on home prices. Home prices have increased year-over-year for the last 78 straight months.

The inventory of homes for sale in the real estate market had been on a steady decline and experienced year-over-year drops for 36 straight months (from July 2015 to May 2018), but we are starting to see a shift in inventory over the last three months.

The chart below shows the change in housing supply over the last 12 months compared to the previous 12 months. As you can see, in June, July, and August, inventory levels have started to increase as compared to the same time last year.

2 Factors to Watch in Today’s Real Estate Market Whether Buying or Selling | Simplifying The Market

This is a trend to watch as we move further into the fall and winter months. If we continue to see an increase in homes for sale, we could start moving further away from a seller’s market and closer to a normal market.

Bottom Line

If you are planning to enter the housing market, either as a buyer or a seller, let’s get together to discuss the changes in mortgage interest rates and inventory and what they could mean for you.

No Comments

Should I Buy Now? Or Wait Until Next Year? [INFOGRAPHIC]

Should I Buy Now? Or Wait Until Next Year? [INFOGRAPHIC] | Simplifying The Market

Some Highlights:

  • The cost of waiting to buy is defined as the additional funds it would take to buy a home if prices & interest rates were to increase over a period of time.
  • Freddie Mac predicts interest rates to rise to 5.2% by the third quarter of 2019.
  • CoreLogic predicts home prices to appreciate by 5.1% over the next 12 months.
  • If you are ready and willing to buy your dream home, find out if you are able to!
No Comments

Are Home Prices Softening or Are They Falling?

Are Home Prices Softening or Are They Falling? | Simplifying The Market

We are beginning to see reports that more housing inventory is coming to the market and that buyer demand may not be increasing at the same pace it did earlier this year. The result will be many headlines written to address the impact that these two situations will have on home values.

Many of these headline writers will confuse “softening home prices” with “falling home prices,” but there is a major difference between the two.

The data will begin to show that home values are not appreciating at the same levels as they had over the last several years (softening prices). This does NOT mean that prices are depreciating (falling prices).

Here is an example: Over the last several years, national home values increased by more than 6% annually. If you had a home worth $300,000 at the beginning of the year, it would be worth $318,000 by year’s end. If the appreciation rate “falls” to 4%, that $300,000 house would be worth $312,000 at the end of next year – a $6,000 difference.

The price of the home did not fall. It just didn’t increase at the level it had the previous year.

Appreciation rates are projected to end this year at approximately 5%, and then drop to somewhere between 4-5% next year. This drop in appreciation rate will cause home price increases to soften.

Again, this does not mean that home prices will depreciate, but instead that they will appreciate more slowly.

Bottom Line

Be careful when reading headlines that discuss home values. Some headline writers will be legitimately confused and will use the word falling in place of softening. Others will realize that the headline “Home Prices are Falling!” will get more clicks than “Home Prices are Softening” and will intentionally write the more compelling headline. Read the article. If the word depreciation is not mentioned, home values are not falling.

No Comments

How Much Has Your Home Increased in Value?

How Much Has Your Home Increased in Value? | Simplifying The Market

Home values have risen dramatically over the last twelve months. In CoreLogic’s most recent Home Price Index Report, they revealed that national home prices have increased by 6.2% year-over-year.

CoreLogic broke down appreciation even further into four price ranges, giving us a more detailed view than if we had simply looked at the year-over-year increases in national median home price.

The chart below shows the four price ranges from the report, as well as each one’s year-over-year growth from July 2017 to July 2018 (the latest data available). 

How Much Has Your Home Increased in Value? | Simplifying The Market

It is important to pay attention to how prices are changing in your local market. The location of your home is not the only factor which determines how much your home has appreciated over the course of the last year.

Lower-priced homes have appreciated at greater rates than homes at the upper ends of the spectrum due to demand from first-time home buyers and baby boomers looking to downsize.

Bottom Line

If you are planning to list your home for sale in today’s market, let’s get together to go over exactly what’s going on in your area and your price range.

No Comments

Home Prices: The Difference 5 Years Makes

Home Prices: The Difference 5 Years Makes | Simplifying The Market

CoreLogic recently released their Home Price Index ReportOne of the key indicators used in the report to determine the health of the housing market was home price appreciation. CoreLogic focused on appreciation from July 2013 to July 2018 to show how prices over the last five years have fared.

The graph below was created to show the 5-year change in price from July 2013 to July 2018 by price range.

Home Prices: The Difference 5 Years Makes | Simplifying The Market

As you can see in the graph, the highest price appreciation occurred in the lowest price range with 48% growth, while the highest priced homes appreciated by 25%. This has been greatly fueled by the lack of inventory of homes available at the lower price ranges and high demand from first-time buyers looking to enter the market.

Where were prices expected to go?

Every quarter, Pulsenomics surveys a nationwide panel of over 100 economists, real estate experts, and investment and market strategists and asks them to project how residential home prices will appreciate over the next five years for their Home Price Expectation Survey (HPES).

According to the Q3 2014 survey results, national homes prices were projected to increase cumulatively by 19.5% by December 2018. The bulls of the group predicted home prices to rise by 27.8%, while the more cautious bears predicted an appreciation of 11.2%.

Where are prices headed in the next 5 years?

Data from the most recent HPES shows that home prices are expected to increase by 20.0% over the next 5 years. The bulls of the group predict home prices to rise by 31.2%, while the more cautious bears predict an appreciation of 9.3%.

Bottom Line

Every day, thousands of homeowners regain positive equity in their homes. Some homeowners are now experiencing values even greater than those before the Great Recession. If you’re wondering if you have enough equity to sell your house and move on to your dream home, let’s get together to discuss conditions in our neighborhood!

No Comments

Home Prices Have Appreciated 6.9% in 2018

Home Prices Have Appreciated 6.9% in 2018 | Simplifying The Market

Between 1987 and 1999, which is often referred to as the ‘Pre-Bubble Period,’ home prices grew at an average of 3.6% according to the Home Price Expectation Survey.

Every month, the economists at CoreLogic release the results of their Home Price Insights Report, which includes the actual year-over-year change in prices across the country and their predictions for the following year.

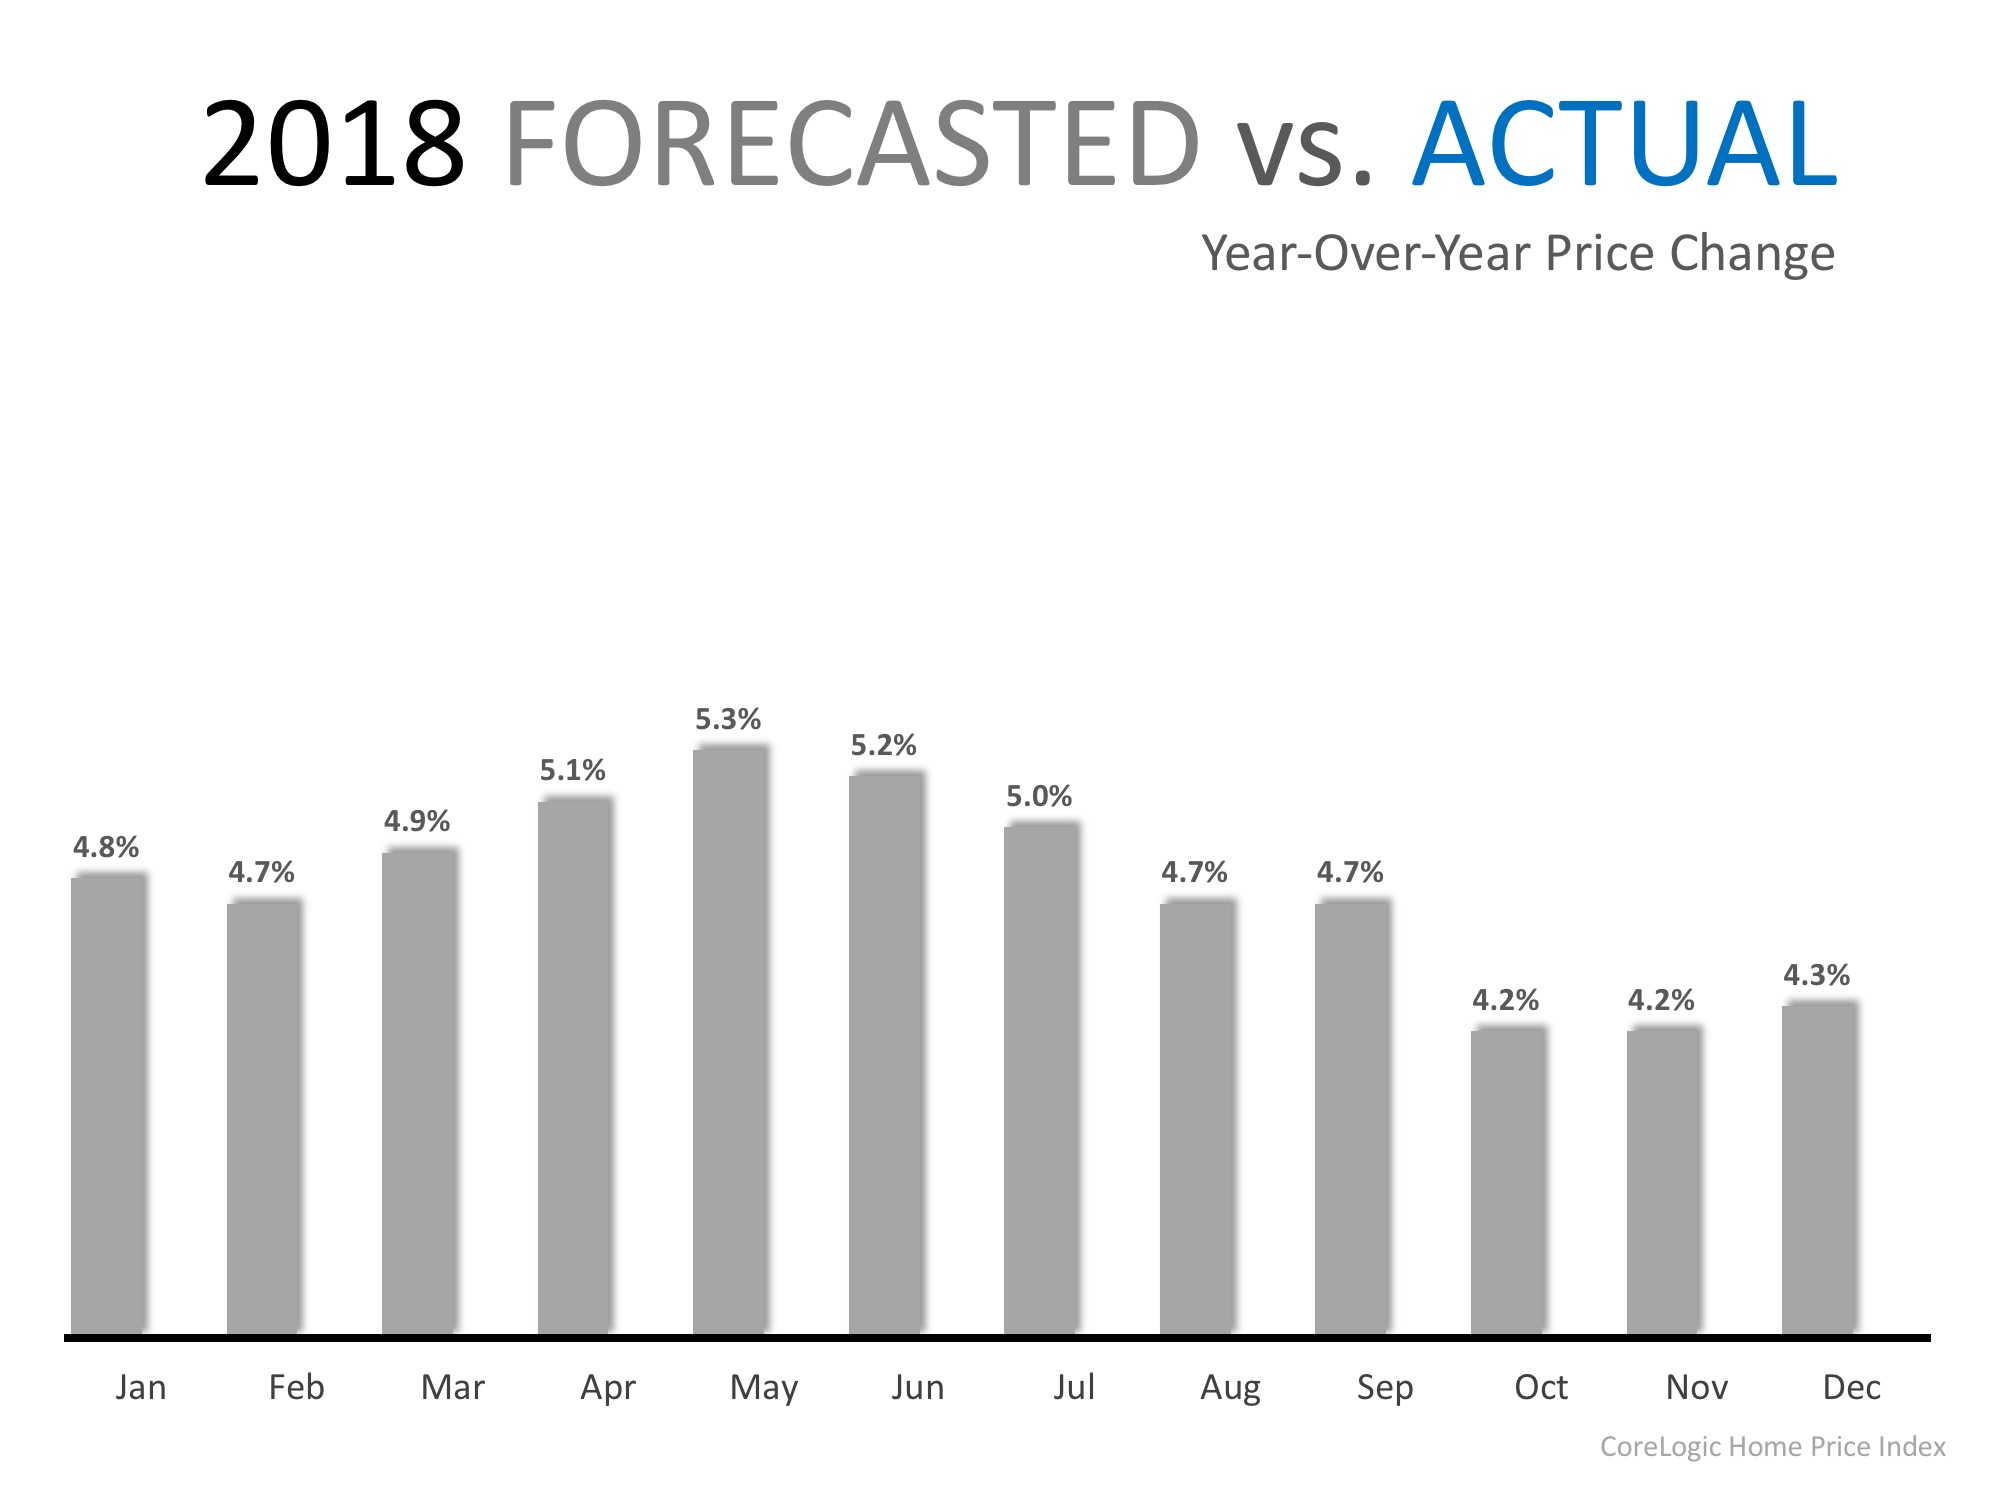
The chart below shows the forecasted year-over-year prices for 2018 (predictions made in 2017). According to their predictions, the average appreciation over the course of 2018 should be 4.8%, which is still greater than the ‘normal’ appreciation of 3.6%.

Home Prices Have Appreciated 6.9% in 2018 | Simplifying The Market

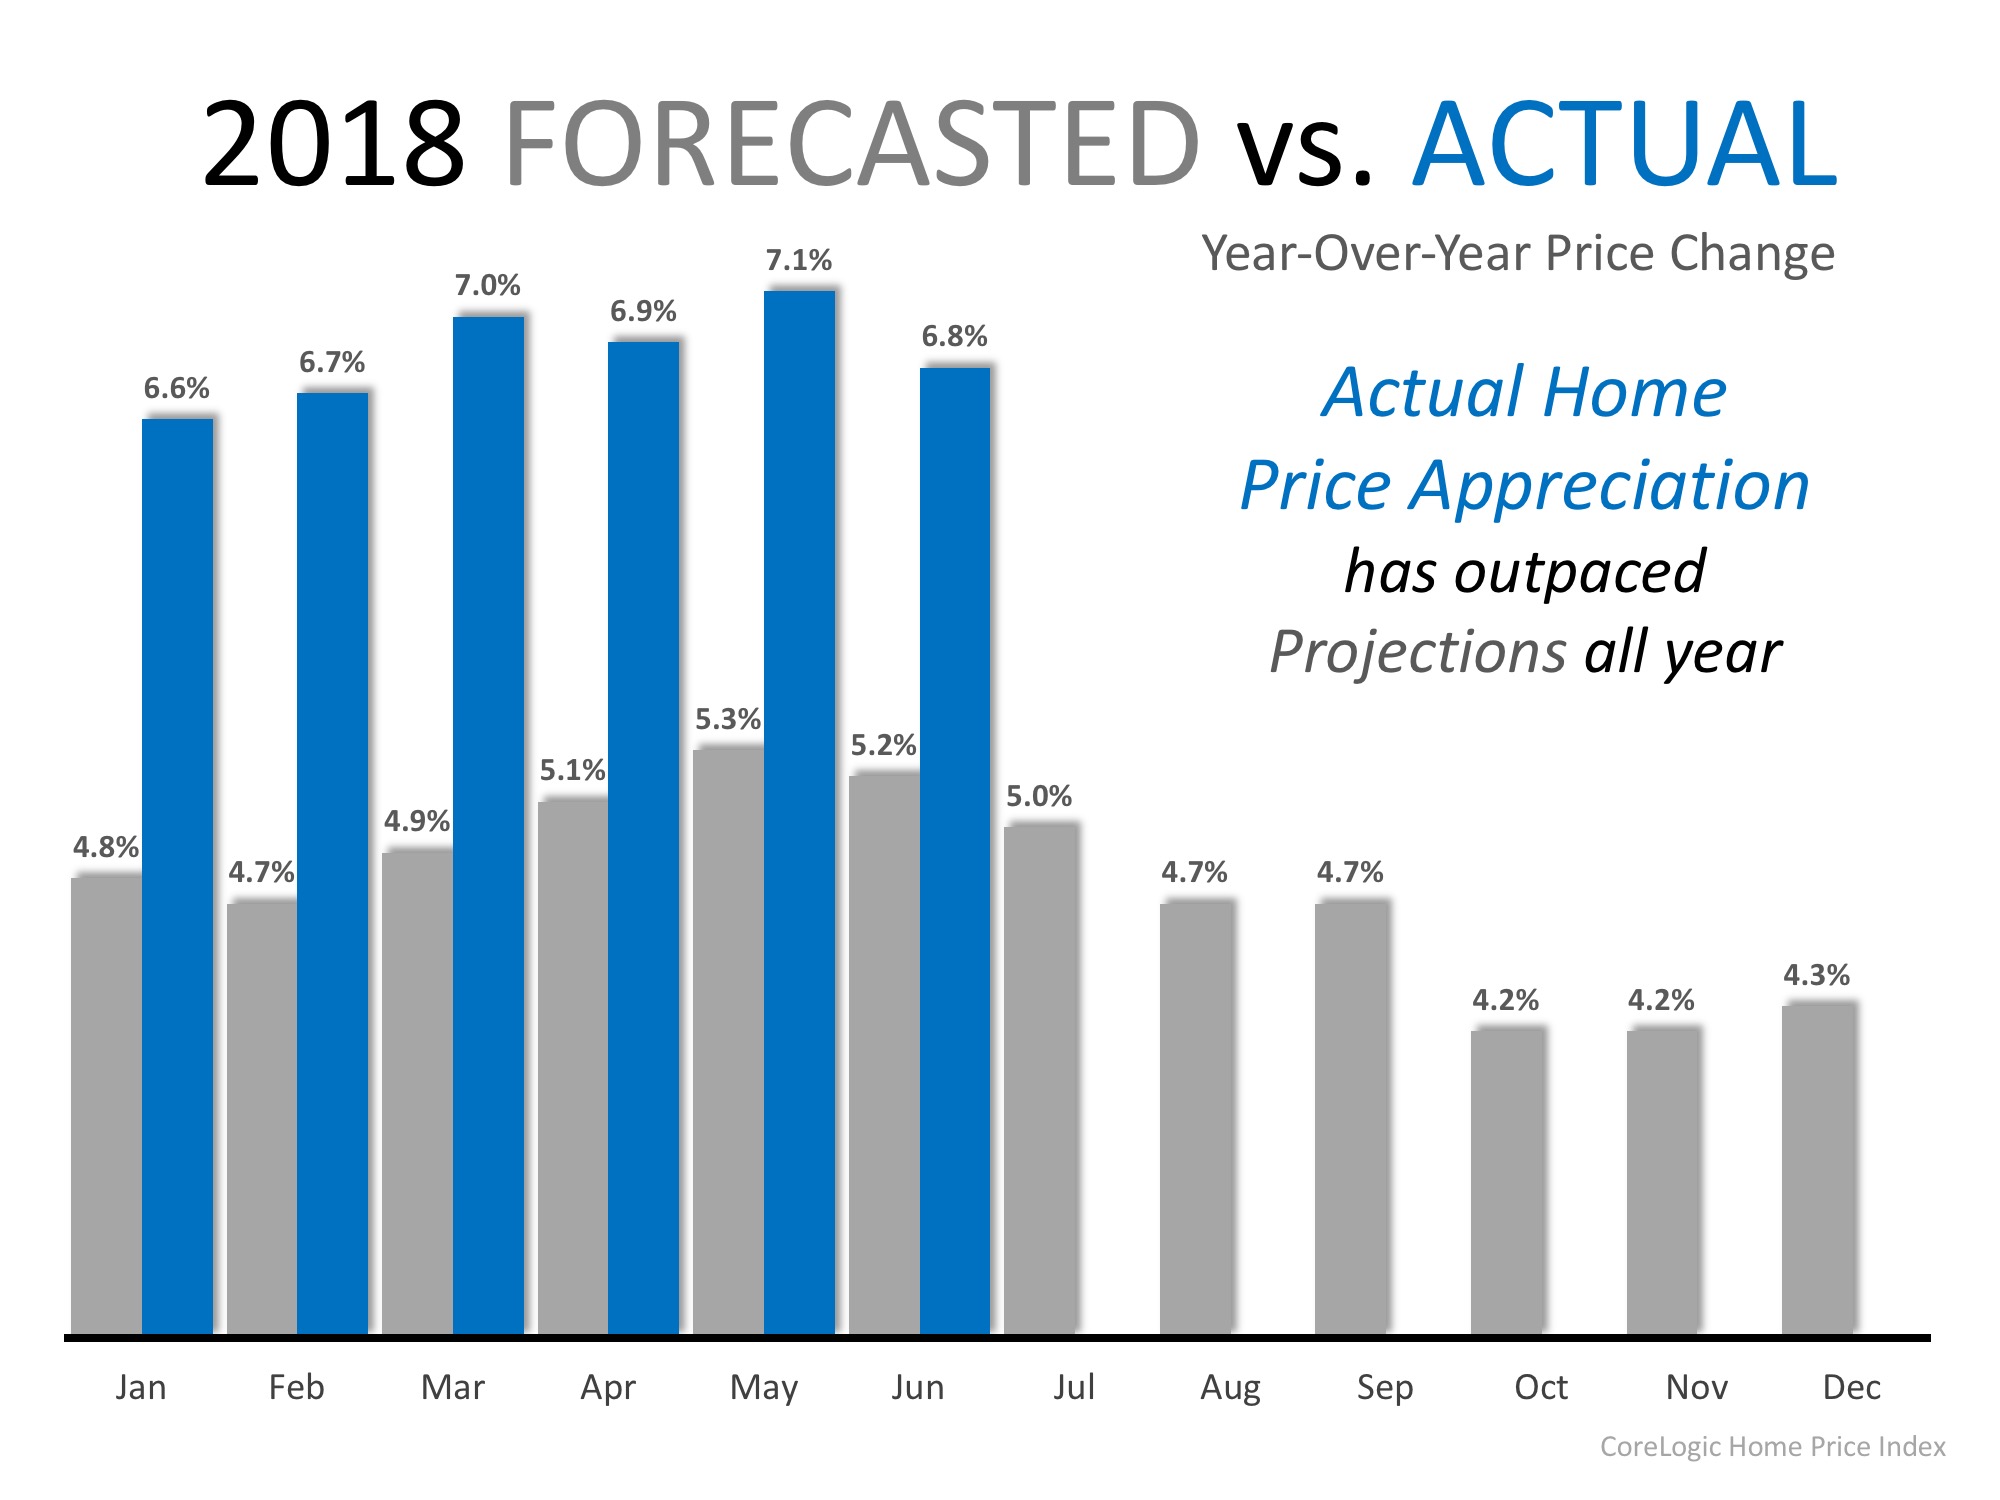
If we layer in the actual price appreciation that has occurred this year, we can see that over the course of 2018, home prices have appreciated by an average of 6.9% and have outpaced projections all year!

Home Prices Have Appreciated 6.9% in 2018 | Simplifying The Market

What does this mean?

The tale of today’s real estate market is one of low inventory, high demand, and rising prices. The forces at work can be simply explained with the theory of supply and demand. That being said, if a large supply of inventory were to come to the market, prices may start to appreciate closer to the forecasted rate which would STILL be greater than the historic norm!

Bottom Line

If you are a homeowner whose house no longer meets your needs, now may be a great time to list your home and capitalize on the equity you have gained over the last year to make a significant down payment on your next home!

No Comments

Home Prices Up 6.49% Across the Country! [INFOGRAPHIC]

Home Prices Up 6.49% Across the Country! [INFOGRAPHIC] | Simplifying The Market

Some Highlights:

  • The Federal Housing Finance Agency (FHFA) recently released their latest quarterly Home Price Index report.
  • In the report, home prices are compared both regionally and by state.
  • Based on the latest numbers, if you plan on relocating to another state, waiting to move may end up costing you more!