No Comments

4 Reasons Why Today’s Housing Market is NOT 2006 All Over Again

4 Reasons Why Today’s Housing Market is NOT 2006 All Over Again | Simplifying The Market

With home prices rising again this year, some are concerned that we may be repeating the 2006 housing bubble that caused families so much pain when it collapsed. Today’s market is quite different than the bubble market of twelve years ago. There are four key metrics that explain why:

  1. Home Prices
  2. Mortgage Standards
  3. Mortgage Debt
  4. Housing Affordability

1. HOME PRICES

There is no doubt that home prices have reached 2006 levels in many markets across the country. However, after more than a decade, home prices should be much higher based on inflation alone.

Frank Nothaft is the Chief Economist for CoreLogic (which compiles some of the best data on past, current, and future home prices). Nothaft recently explained:

“Even though CoreLogic’s national home price index got to the same level it was at the prior peak in April of 2006, once you account for inflation over the ensuing 11.5 years, values are still about 18% below where they were.” (emphasis added)

2. MORTGAGE STANDARDS

Some are concerned that banks are once again easing lending standards to a level similar to the one that helped create the last housing bubble. However, there is proof that today’s standards are nowhere near as lenient as they were leading up to the crash.

The Urban Institute’s Housing Finance Policy Center issues a Housing Credit Availability Index (HCAI). According to the Urban Institute:

“The HCAI measures the percentage of home purchase loans that are likely to default—that is, go unpaid for more than 90 days past their due date. A lower HCAI indicates that lenders are unwilling to tolerate defaults and are imposing tighter lending standards, making it harder to get a loan. A higher HCAI indicates that lenders are willing to tolerate defaults and are taking more risks, making it easier to get a loan.”

The graph below reveals that standards today are much tighter on a borrower’s credit situation and have all but eliminated the riskiest loan products.

4 Reasons Why Today’s Housing Market is NOT 2006 All Over Again | Simplifying The Market

3. MORTGAGE DEBT

Back in 2006, many homeowners mistakenly used their homes as ATMs by withdrawing their equity and spending it with no concern for the ramifications. They overloaded themselves with mortgage debt that they couldn’t (or wouldn’t) repay when prices crashed. That is not occurring today.

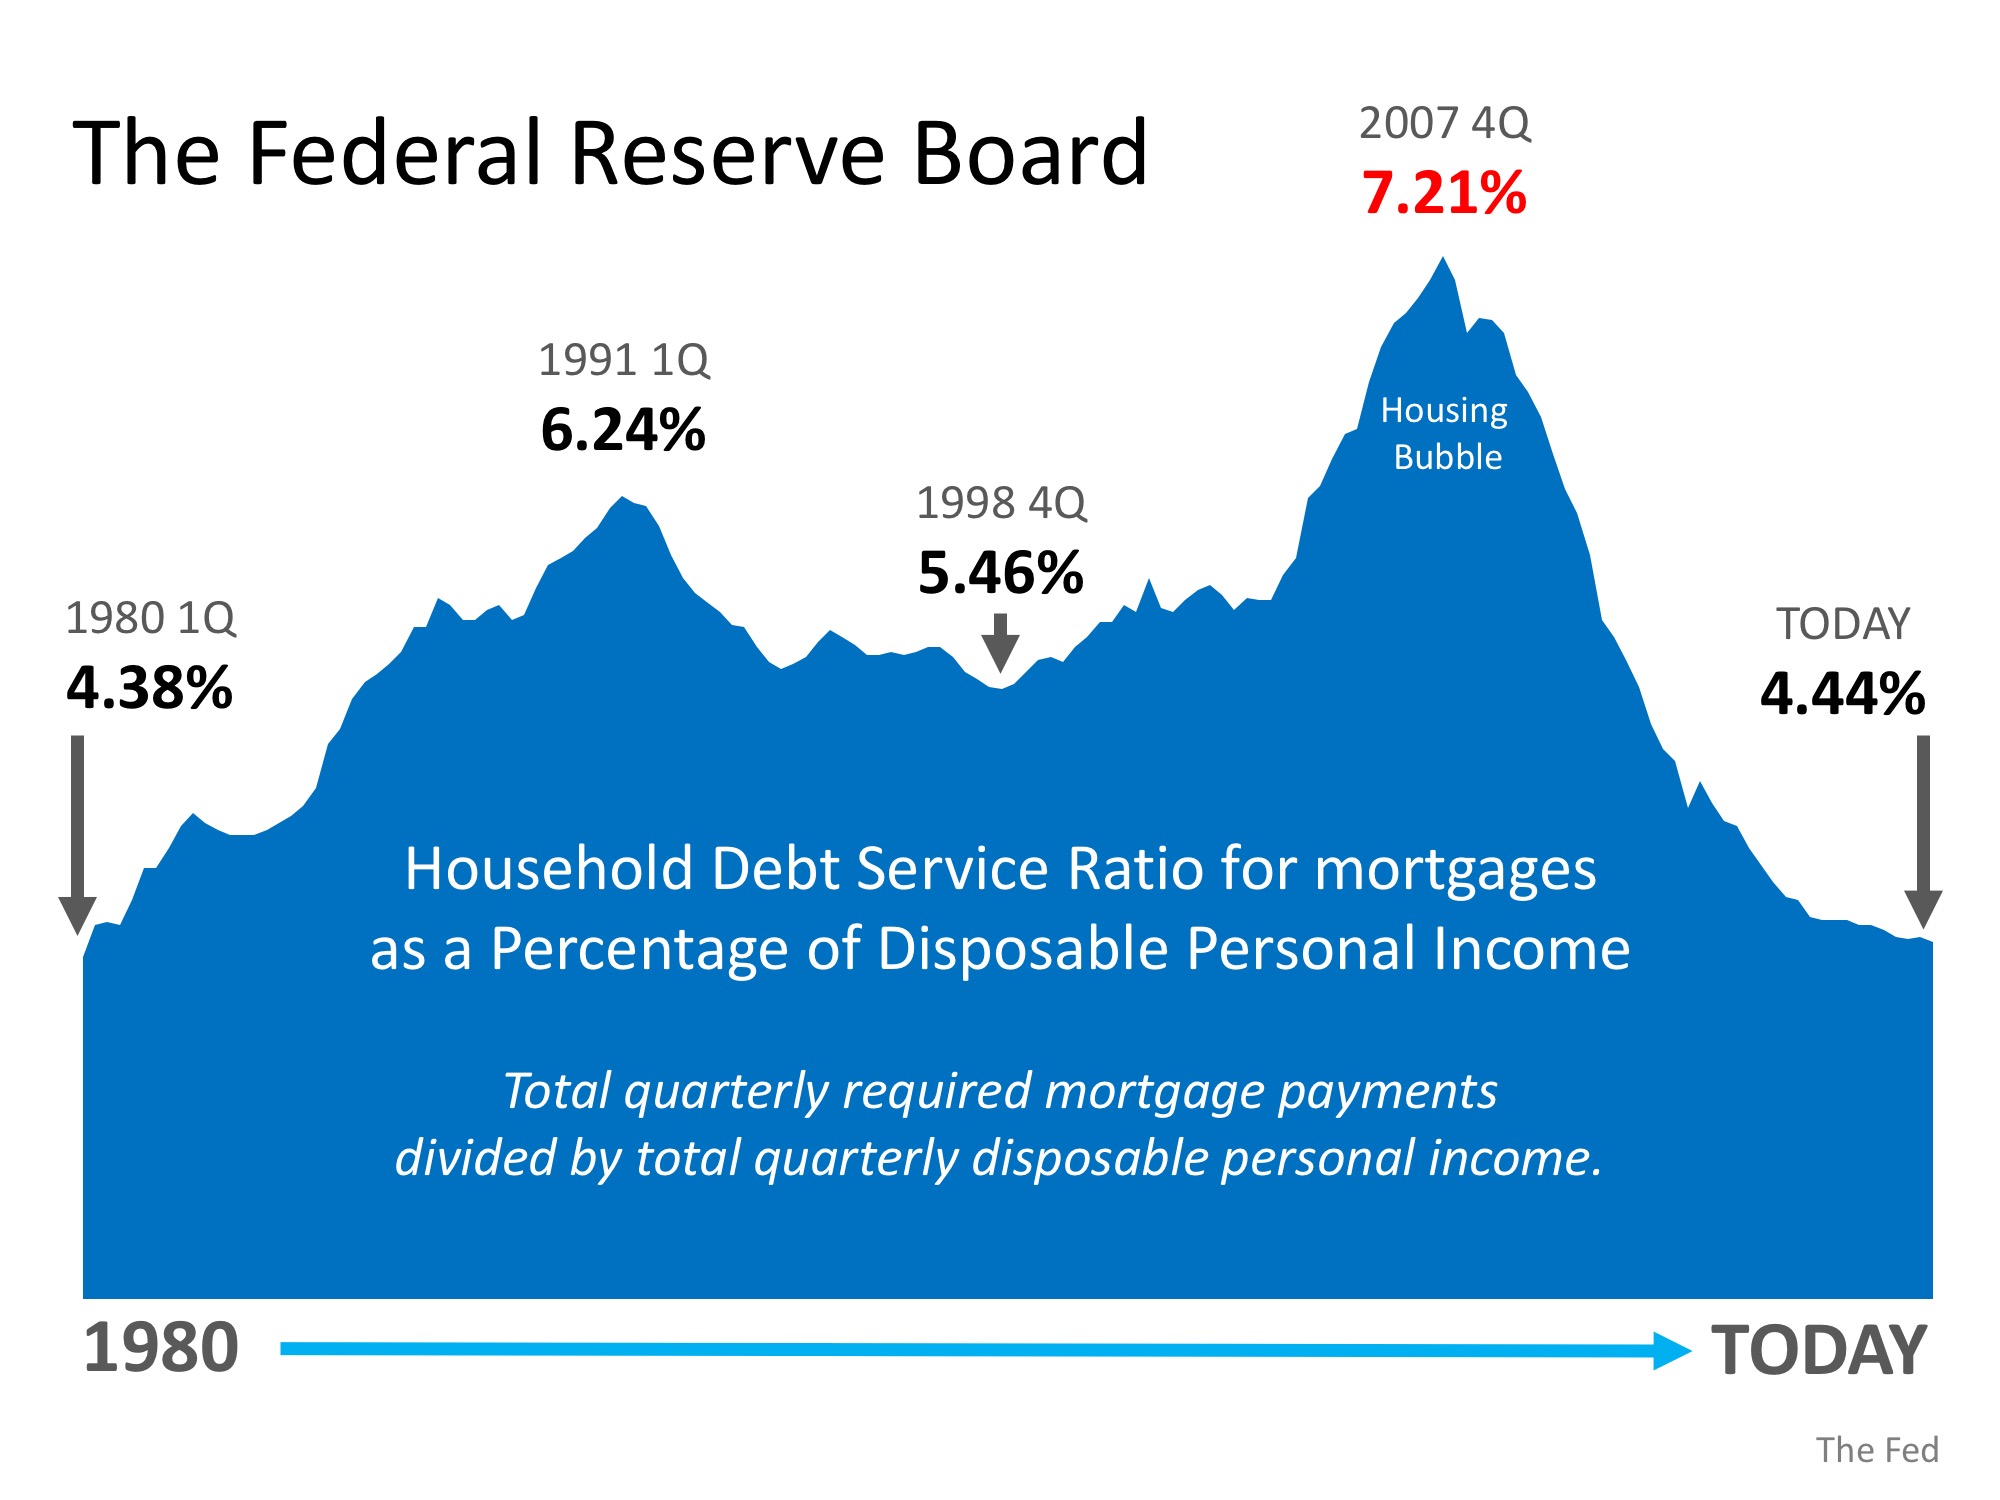
The best indicator of mortgage debt is the Federal Reserve Board’s household Debt Service Ratio for mortgages, which calculates mortgage debt as a percentage of disposable personal income.

At the height of the bubble market a decade ago, the ratio stood at 7.21%. That meant over 7% of disposable personal income was being spent on mortgage payments. Today, the ratio stands at 4.48% – the lowest level in 38 years!

4. HOUSING AFFORDABILITY

With both house prices and mortgage rates on the rise, there is concern that many buyers may no longer be able to afford a home. However, when we look at the Housing Affordability Index released by the National Association of Realtors, homes are more affordable now than at any other time since 1985 (except for when prices crashed after the bubble popped in 2008).

4 Reasons Why Today’s Housing Market is NOT 2006 All Over Again | Simplifying The Market

Bottom Line

After using four key housing metrics to compare today to 2006, we can see that the current market is not anything like the bubble market.

No Comments

“Short of a war or stock market crash…”

“Short of a war or stock market crash…” | Simplifying The Market

This month, Arch Mortgage Insurance released their spring Housing and Mortgage Market Review. The report explained that an increase in mortgage rates and/or home prices would impact monthly payments this way:

  • A 5% increase in home prices increases payments by roughly 5%
  • A 1% rise in interest rates increases payments by roughly 13% or 14%

That begs the question…

What if both rates and prices increase as predicted?

The report revealed:

“If interest rates and home prices rise by year-end in the ballpark of what most analysts are forecasting, monthly mortgage payments on a new home purchase could increase another 10–15%. That would make 2018 one of the worst full-year deteriorations in affordability for the past 25 years.”

The percent increase in mortgage payments would negatively impact affordability. But, how would affordability then compare to historic norms?

Per the report:

“For the U.S. overall, even if affordability were to deteriorate as forecasted, affordability would still be reasonable by historic norms. That is because the percentage of pre-tax income needed to buy a typical home in 2019 would still be similar to the historical average during 1987–2004. Thus, nationally at least, even with higher rates and home prices, affordability will just revert to historical norms.”

What about home prices?

A decrease in affordability will cause some concern about home values. Won’t an increase in mortgage payments negatively impact the housing market? The report addressed this question:

“Even recent interest rate increases and higher taxes on some upper-income earners didn’t slow the market, as many had feared…Short of a war or stock market crash, housing markets could continue to surprise on the upside over the next few years.”

To this point, Arch Mortgage Insurance also revealed their Risk Index which estimates the probability of home prices being lower in two years. The index is based on factors such as regional unemployment rates, affordability, net migration, housing starts and the percentage of delinquent mortgages.

Below is a map depicting their projections (the darker the blue, the lower the probability of a price decrease):

“Short of a war or stock market crash…” | Simplifying The Market

Bottom Line

If interest rates and prices continue to rise as projected, the monthly mortgage payment on a home purchased a year from now will be dramatically more expensive than it would be today.

No Comments

Is Family Mortgage Debt Out of Control?

Is Family Mortgage Debt Out of Control? | Simplifying The Market

Some homeowners have recently done a “cash out” refinance and have taken a portion of their increased equity from their house. Others have sold their homes and purchased more expensive homes with larger mortgages. At the same time, first-time buyers have become homeowners and now have mortgage payments for the first time.

These developments have caused concern that families might be reaching unsustainable levels of mortgage debt. Some are worried that we may be repeating a behavior that helped precipitate the housing crash ten years ago.

Today, we want to assure everyone that this is not the case. Here is a graph created from data released by the Federal Reserve Board which shows the Household Debt Service Ratio for mortgages as a percentage of disposable personal income. The ratio is the total quarterly required mortgage payments divided by total quarterly disposable personal income. In other words, the percentage of spendable income people are using to pay their mortgage.

Is Family Mortgage Debt Out of Control? | Simplifying The Market

Today’s ratio of 4.44% is nowhere near the ratio of 7.21% during the peak of the housing bubble and is instead at the lowest rate since 1980 (4.38%).

Bill McBride of Calculated Risk recently commented on the ratio:

“The Debt Service Ratio for mortgages is near the low for the last 38 years. This ratio increased rapidly during the housing bubble and continued to increase until 2007. With falling interest rates, and less mortgage debt, the mortgage ratio has declined significantly.”

Bottom Line

Many families paid a heavy price because of questionable practices that led to last decade’s housing crash. It seems the American people have learned a lesson and are not repeating that same behavior regarding their mortgage debt.

No Comments

The COST of Your Next Home Will Be LESS Than Your Parents’ Home Was

The COST of Your Next Home Will Be LESS Than Your Parents' Home Was | Simplifying The Market

There is no doubt that the price of a home in most regions of the country is greater now than at any time in history. However, when we look at the cost of a home, it is cheaper to own today than it has been historically.

The Difference Between PRICE and COST

The price of a home is the dollar amount you and the seller agree to at the time of purchase. The cost of a home is the monthly expense you pay for your mortgage payment.

To accurately compare costs in different time periods, we must look at home prices, mortgage rates, and wages during each period. Home prices were less expensive years ago, but paychecks were also smaller and mortgage rates were much higher (the average mortgage interest rate in 1988 was 10.34%).

The best way to measure the COST of a home is to determine what percentage of income is necessary to buy a home at the time. That would take into account the price of the home, the mortgage interest rate and wages at the time.

Zillow just released research that examined home costs using this formula. The research compares the historic percentage of income necessary to afford a mortgage to the percentage needed today. It also revealed the cost if mortgage rates continue to rise as experts are predicting. Here is a graph of their findings*:

The COST of Your Next Home Will Be LESS Than Your Parents' Home Was | Simplifying The Market

Rates would need to jump to 7% in order for the percentage of necessary income to be greater than historic norms.

Bottom Line

Whether you are a homeowner considering selling your current house and moving up to the home of your dreams, or a first-time buyer trying to purchase your first home, it’s a great time to move forward.

*Assumptions in the Zillow report: Buyer puts 20% down, takes out a conforming, 30-year fixed-rate mortgage at rates prevailing at the time, earns the median household income, and is buying a median-valued home.
No Comments

Mortgage Interest Rates Have Begun to Level Off

Mortgage Interest Rates Have Begun to Level Off | Simplifying The Market

Whether you are a buyer searching for your first home, or a homeowner looking to move up to your next home, you should pay attention to where mortgage interest rates are heading.

Over the course of 2018, according to Freddie Mac’s Primary Mortgage Market Survey, rates have increased from 3.95% in the first week of January to 4.40% in the first week of April.

At first glance, the difference between these numbers in such a short amount of time could be concerning, but if we look at the graph below, we’ll see that rates have already started to level off and return to the mark set in February.

Mortgage Interest Rates Have Begun to Level Off | Simplifying The Market

This is great news for anyone looking to buy a home this spring! The spring is always one of the busiest seasons for home buying, and with rates increasing even more, buyers have come off the fence to lock in great rates! This is still great advice as the experts believe that rates will continue to rise throughout the year.

Every month, Freddie Mac, Fannie Mae, the Mortgage Bankers Association and the National Association of Realtors release their projections for where they believe mortgage rates will be in the coming months. If we take the average of what each of the four organizations is predicting for the second quarter, rates are expected to rise to about 4.48% by June.

That average climbs to 4.73% by the end of this year.

So, what does this mean?

Waiting until the end of the year to buy, with rates still projected to increase, will end up costing you more money on your monthly mortgage payment. For every $250,000 you need to borrow to purchase your dream home, you will spend $49.21 more per month, $590.52 per year, and over $17,700 by the end of your 30-year mortgage.

And that’s just the impact of your interest rate going up!

Bottom Line

If you are ready and willing to purchase a home, find out if you’re able to. Let’s get together to evaluate your needs and help you with next steps!

No Comments

Be Thankful You Don’t Have to Pay Your Parents’ Interest Rate!

Be Thankful You Don’t Have to Pay Your Parents’ Interest Rate! | Simplifying The Market

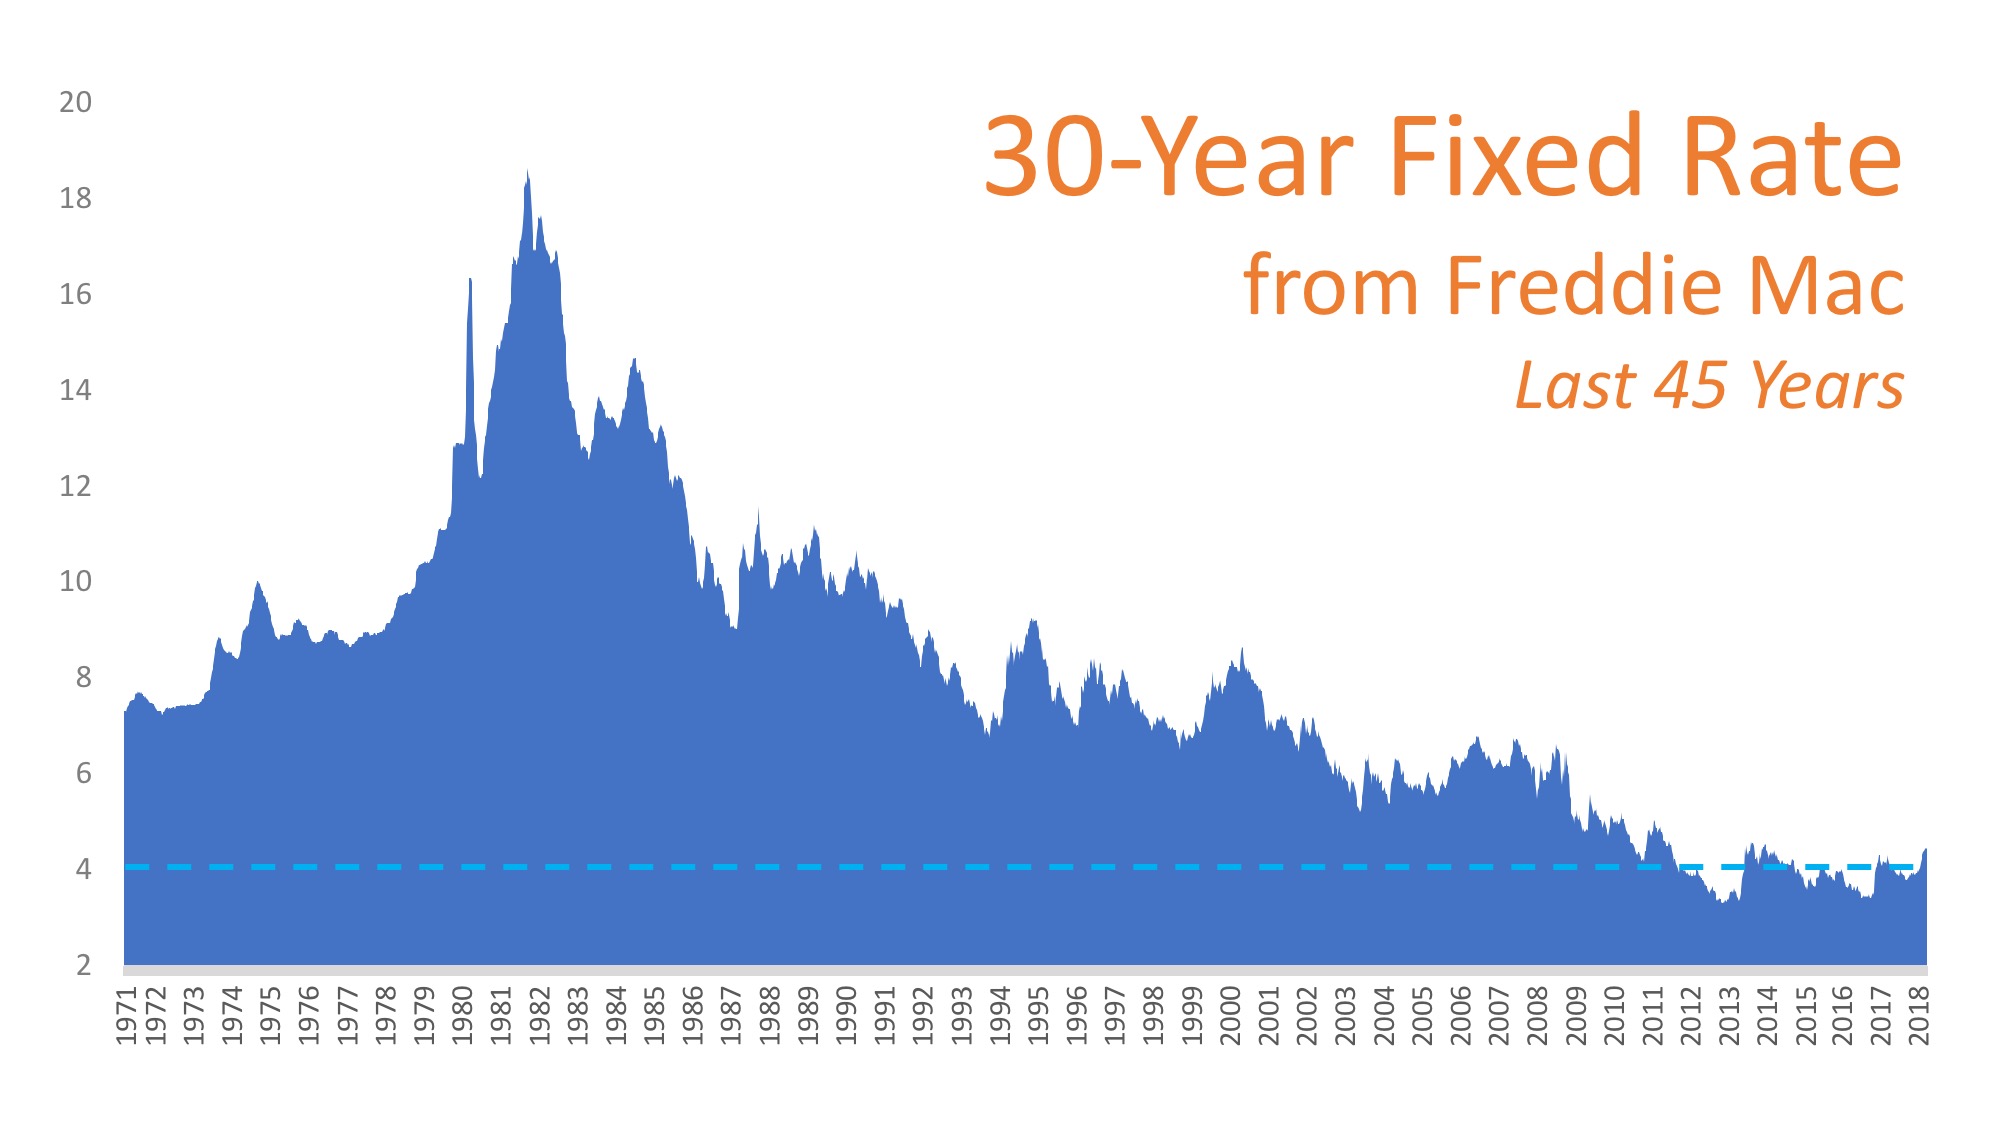
Interest rates hovered around 4% for the majority of 2017, which gave many buyers relief from rising home prices and helped with affordability. In the first quarter of 2018, rates have increased from 3.95% up to 4.45% and experts predict that rates will increase even more by the end of the year.

The rate you secure greatly impacts your monthly mortgage payment and the amount you will ultimately pay for your home. Don’t let the prediction that rates will increase stop you from purchasing your dream home this year.

Let’s take a look at a historical view of interest rates over the last 45 years.

Be Thankful You Don’t Have to Pay Your Parents’ Interest Rate! | Simplifying The Market

Bottom Line

Be thankful that you can still get a better interest rate than your older brother or sister did ten years ago, a lower rate than your parents did twenty years ago, and a better rate than your grandparents did forty years ago.

No Comments

Freddie Mac: Rising Mortgage Rates DO NOT Lead to Falling Home Prices

Freddie Mac: Rising Mortgage Rates DO NOT Lead to Falling Home Prices | Simplifying The Market

Recently, Freddie Mac published an Insight Report titled Nowhere to go but up? How increasing mortgage rates could affect housing. The report focused on the impact the projected rise in mortgage rates might have on the housing market this year.

Many believe that an increase in mortgage rates will cause a slowdown in purchases which would, in turn, lead to a fall in house values. Ultimately, however, prices are determined by supply and demand and while rising mortgage rates may slow demand, they also affect supply. From the report:

 “For current homeowners, the decision to buy a new home is typically linked to their decision to sell their current home… Because of this link, the financing costs of the existing mortgage are part of the homeowner’s decision of whether and when to move.

Once financing costs for a new mortgage rise above the rate borrowers are paying for their current mortgage, borrowers would have to give up below-market financing to sell their home.

Instead, they may choose to delay both the sale of their existing home and the purchase of a new home to maintain the advantageous financing.”

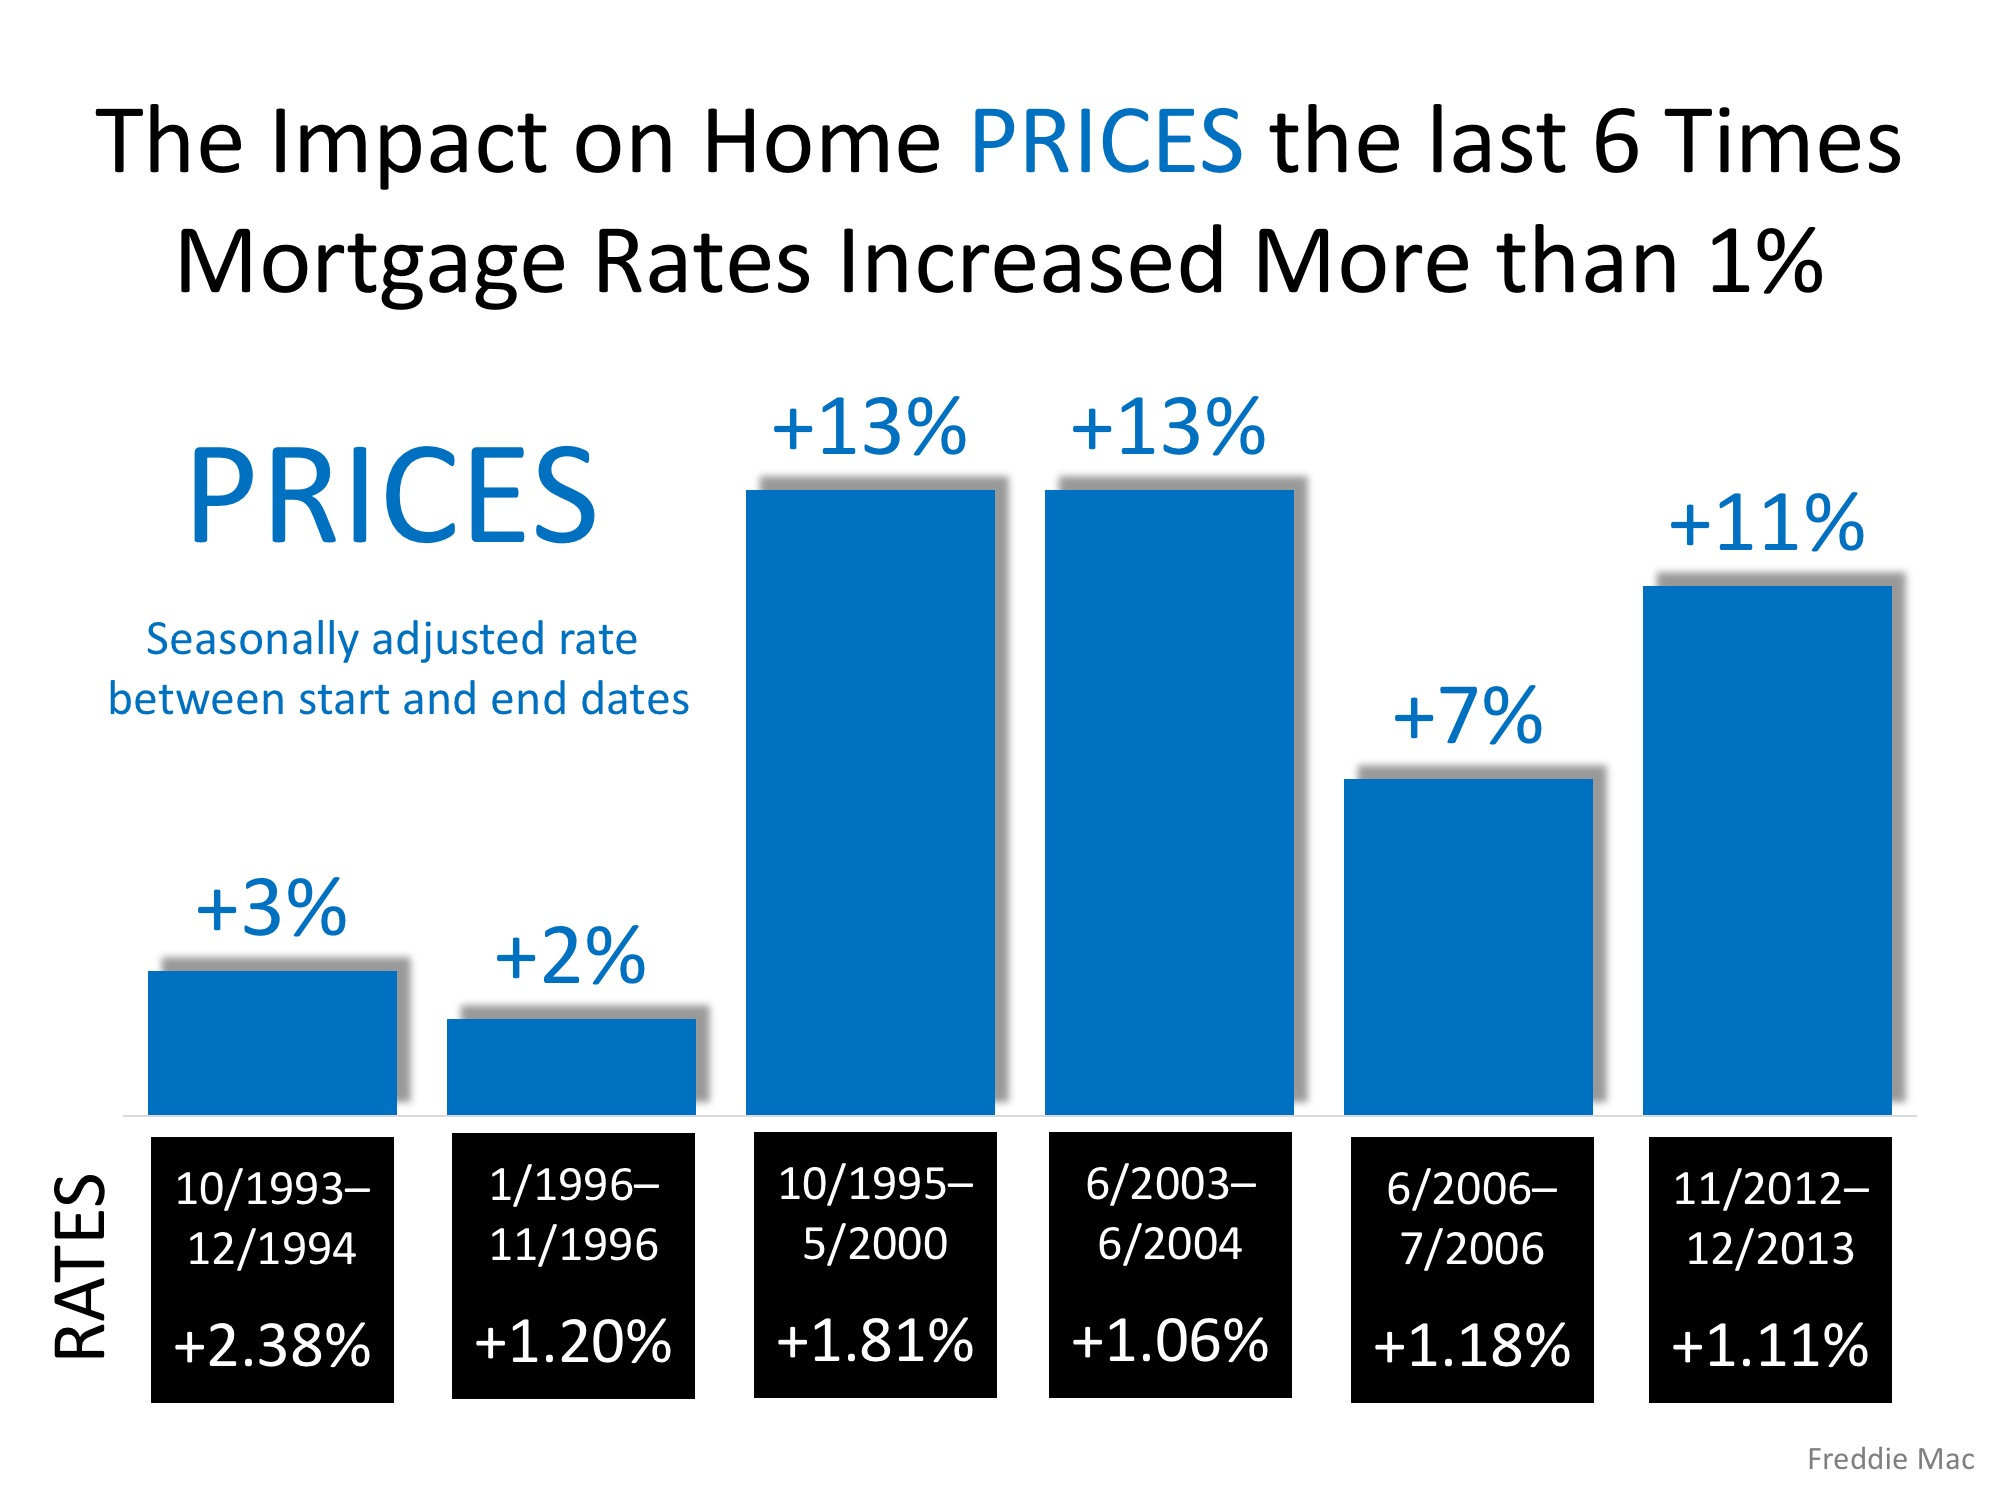
The Freddie Mac report, in acknowledging this situation, concluded that prices are not adversely impacted by higher mortgage rates. They explained:

“While there is a drop in the demand for homes, there is an associated drop in the supply of homes from the link between the selling and buying decisions. As both supply and demand move together in this way they have offsetting effects on price—lower demand decreases price and lower supply increases price.

They went on to reveal that the Freddie Mac National House Price Index is…

“…unresponsive to movements in interest rates. In the current housing market, the driving force behind the increase in prices is a low supply of both new and existing homes combined with historically low rates. As mortgage rates increase, the demand for home purchases will likely remain strong relative to the constrained supply and continue to put upward pressure on home prices.”

The following graph, based on data from the report, reveals what happened to home prices the last six times mortgage rates rose by at least 1%.

Freddie Mac: Rising Mortgage Rates DO NOT Lead to Falling Home Prices | Simplifying The Market

Bottom Line

Whether you are a move-up buyer or first-time buyer, waiting to purchase your next home based on the belief that prices will fall because of rising mortgage rates makes no sense.