No Comments

The Cost of NOT Paying PMI

The Cost of NOT Paying PMI | Simplifying The Market

Saving for a down payment is often the biggest hurdle for a first-time homebuyer as median incomes, rents, and home prices all vary depending on where you live.

There is a common misconception among homebuyers that a 20% down payment is required, and it is this limiting belief that often adds months, and sometimes even years, to the home-buying process.

So, if you can purchase a home with less than a 20% down payment… why aren’t more people doing just that?

One Possible Answer: Private Mortgage Insurance (PMI)

Freddie Mac defines PMI as:

“An insurance policy that protects the lender if you are unable to pay your mortgage. It’s a monthly fee, rolled into your mortgage payment, that is required for all conforming, conventional loans that have down payments less than 20%.

Once you’ve built equity of 20% in your home, you can cancel your PMI and remove that expense from your mortgage payment.”

As the borrower, you pay the monthly premiums for the insurance policy, and the lender is the beneficiary. The monthly cost of your PMI depends on the home’s value, the amount of your down payment, and your credit score.

Below is a table showing the difference in monthly mortgage payment for a $250,000 home with a 3% down payment and PMI vs. a 20% down payment without PMI:

The Cost of NOT Paying PMI | Simplifying The Market

The first thing you see when looking at the table above is no doubt the added $320 a month that you would be spending on your monthly mortgage cost. The second thing that should stand out is that a 20% down payment is $50,000!

If you are buying your first home, $50,000 is a large sum of money that takes discipline and sacrifice to save. Many first-time buyers save for 5-10 years before buying their homes.

To save $50,000 in 10 years, you would need to save about $420 a month. On the other hand, if you save that same $420 a month, you could afford a 3% down payment in less than a year and a half.

In a recent article by My Mortgage Insider, they explain what could happen in the market while you are waiting to save for a higher down payment:

“The time it takes to save a (larger) down payment could mean higher home prices and tougher qualifying down the road. For many buyers, it could prove much cheaper and quicker to opt for the 3% down mortgage immediately.”

The article went on to say,

“Since renters typically devote a higher percentage of their income to housing than homeowners, providing flexible down payment options can help renters with solid earnings purchase a home – and gain a fixed-rate mortgage with principal and interest payments that will not increase over the life of the loan.”

If the prospect of having to pay PMI is holding you back from buying a home today, Freddie Mac has this advice,

“It’s no doubt an added cost, but it’s enabling you to buy now and begin building equity versus waiting 5 to 10 years to build enough savings for a 20% down payment.”

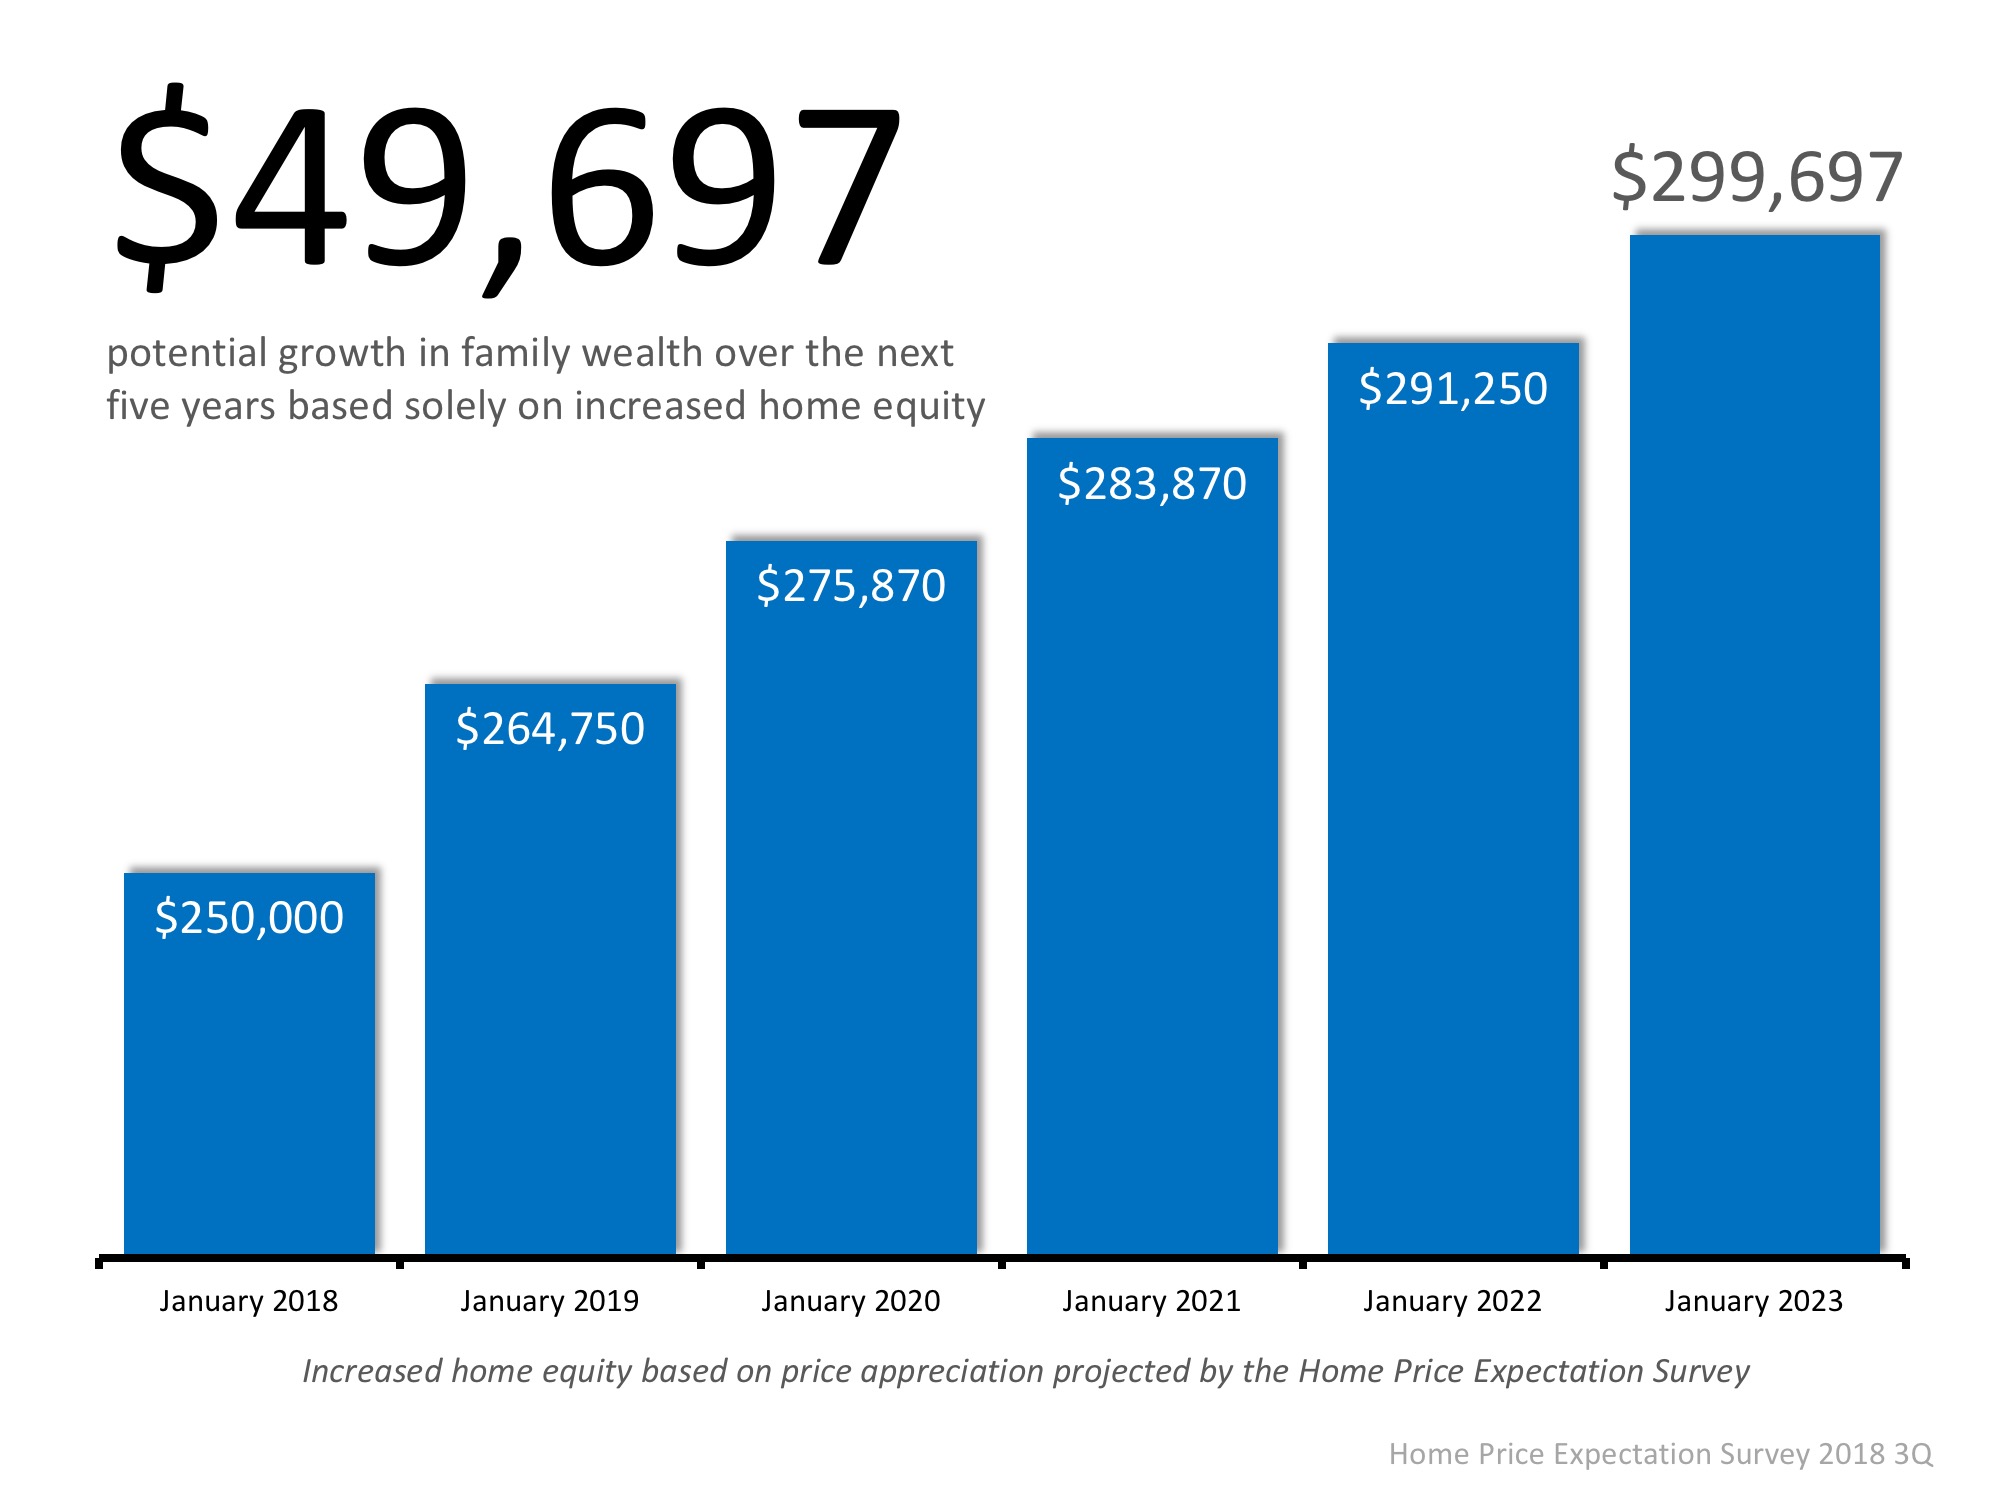
Based on results of the most recent Home Price Expectation Survey, a homeowner who purchased a $250,000 home in January would gain $50,000 in equity over the next five years based on home price appreciation alone (shown below).

The Cost of NOT Paying PMI | Simplifying The Market

Bottom Line

If you have questions about whether you should buy now or wait until you’ve saved a larger down payment, let’s get together to discuss our market’s conditions and help you make the best decision for you and your family.

No Comments

5 Real Estate Reality TV Myths Explained

5 Real Estate Reality TV Myths Explained | Simplifying The Market

Have you ever been flipping through the channels, only to find yourself glued to the couch in an HGTV binge session? We’ve all been there, watching entire seasons of “Love it or List it,” “Million Dollar Listing,” “House Hunters,” “Property Brothers,” and so many more all in one sitting.

When you’re in the middle of your real estate themed show marathon, you might start to think that everything you see on TV must be how it works in real life, but you may need a reality check.

Reality TV Show Myths vs. Real Life:

Myth #1: Buyers look at 3 homes and decide to purchase one of them.
Truth: There may be buyers who fall in love and buy the first home they see, but according to the National Association of Realtors the average homebuyer tours 10 homes as a part of their search.  

Myth #2: The houses the buyers are touring are still for sale.
Truth: Everything is staged for TV. Many of the homes being shown are already sold and are off the market. 

Myth #3: The buyers haven’t made a purchase decision yet.
Truth: Since there is no way to show the entire buying process in a 30-minute show, TV producers often choose buyers who are further along in the process and have already chosen a home to buy. 

Myth #4: If you list your home for sale, it will ALWAYS sell at the open house.
Truth: Of course, this would be great! Open houses are important to guarantee the most exposure to buyers in your area but are only a PIECE of the overall marketing of your home. Keep in mind that many homes are sold during regular listing appointments as well. 

Myth #5: Homeowners decide to sell their homes after a 5-minute conversation.
Truth: Similar to the buyers portrayed on the shows, many of the sellers have already spent hours deliberating the decision to list their homes and move on with their lives/goals.

Bottom Line

Having an experienced professional on your side while navigating the real estate market is the best way to guarantee that you can make the home of your dreams a reality!

No Comments

Buying Is Now 26.3% Cheaper Than Renting in the US

Buying Is Now 26.3% Cheaper Than Renting in the US | Simplifying The Market

The results of the latest Rent vs. Buy Report from Trulia show that homeownership remains cheaper than renting, with a traditional 30-year fixed rate mortgage, in 98 of the 100 largest metro areas in the United States.

In the six years that Trulia has conducted this study, this is the first time that it was cheaper to rent than buy in any of the metropolitan areas.

It’s no surprise, however, that those two metros are San Jose and San Francisco, CA, where median home prices have jumped to over $1 million dollars this year. Home values in San Jose have risen 29% in the last year, while rents have remained relatively unchanged.

For the 98 metros where homeownership wins out, 97 of them show a double-digit advantage when buying. The range is an average of 2.0% less expensive in Honolulu (HI), all the way up to 48.9% in Detroit (MI), and 26.3% nationwide!

Below is a map of the 100 metros that were studied. The darker the blue dot on the metro, the cheaper it is to buy there.

Buying Is Now 26.3% Cheaper Than Renting in the US | Simplifying The Market

In order to calculate the true cost of renting vs. buying, Trulia includes all assumed renting costs, including one-time costs (like security deposits), and compares them to the monthly costs of owning a home (insurance, mortgage payments, taxes, and maintenance) including one-time costs (down payments, closing costs, sale proceeds). They also assume that households stay in their home for seven years, put down a 20% down payment, and take out a 30-year fixed rate mortgage. The full methodology is included with the study results here.

Below is a chart created with the data from the last six years of the study, showing the impact of the median home price, rental price, and 30-year fixed rate interest rate used to calculate the ‘cheaper to buy’ metric.

Buying Is Now 26.3% Cheaper Than Renting in the US | Simplifying The Market

In 2016, when buying was 41.3% less expensive than renting, the average mortgage rate was the driving force behind the difference. Rates this year are the highest they have been in six years which has narrowed the gap, all while home price appreciation has also been driven up by a lack of homes for sale.

Cheryl Young, Trulia’s Chief Economist, had this to say,

“One point deserves emphasizing: The ultra-costly San Francisco Bay Area is not a harbinger for the nation as a whole. While renting may outweigh buying in San Jose and San Francisco, it is unlikely that renting will tip the scales nationally anytime soon.”

Bottom Line

Homeownership provides many benefits beyond the financial ones. If you are one of the many renters out there who would like to evaluate your ability to buy this year, let’s get together to find your dream home.

No Comments

First-Time Home Buyers Continue to Put Down Less Than 6%!

First-Time Home Buyers Continue to Put Down Less Than 6%! | Simplifying The Market

According to the Realtors Confidence Index from the National Association of Realtors, 61% of first-time homebuyers purchased their homes with down payments below 6% in 2017.

Many potential homebuyers believe that a 20% down payment is necessary to buy a home and have disqualified themselves without even trying, but in March, 71% of first-time buyers and 54% of all buyers put less than 20% down.

Ralph McLaughlin, Chief Economist and Founder of Veritas Urbis Economics, recently shed light on why buyer demand has remained strong,

“The fact that we now have four consecutive quarters where owner households increased while renters households fell is a strong sign households are making the switch from renting to buying.

Households under 35 – which represent the largest potential pool of new homeowners in the U.S. – have shown some of the largest gains. While they only make up a third of all homebuyers, the steady uptick in their homeownership rate over the past year suggests their enormous purchasing power may be finally coming to [the] housing market.”

It’s no surprise that with rents rising, more and more first-time buyers are taking advantage of low-down-payment mortgage options to secure their monthly housing costs and finally attain their dream homes.

Bottom Line

If you are one of the many first-time buyers unsure of whether or not they would qualify for a low-down payment mortgage, let’s get together and set you on your path to homeownership!

No Comments

House-Buying Power at Near-Historic Levels

House-Buying Power at Near-Historic Levels | Simplifying The Market

We keep hearing that home affordability is approaching crisis levels. While this may be true in a few metros across the country, housing affordability is not a challenge in the clear majority of the country. In their most recent Real House Price Index, First American reported that consumer “house-buying power” is at “near-historic levels.”

Their index is based on three components:

  1. Median Household Income
  2. Mortgage Interest Rates
  3. Home Prices

The report explains:

“Changing incomes and interest rates either increase or decrease consumer house-buying power or affordability. When incomes rise and/or mortgage rates fall, consumer house-buying power increases.”

Combining these three crucial pieces of the home purchasing process, First American created an index delineating the actual home-buying power that consumers have had dating back to 1991.

Here is a graph comparing First American’s consumer house-buying power (blue area) to the actual median home price that year from the National Association of Realtors (yellow line).

House-Buying Power at Near-Historic Levels | Simplifying The Market

Consumer house-buyer power has been greater than the actual price of a home since 1991. And, the spread is larger over the last decade.

Bottom Line

Even though home prices are increasing rapidly and are now close to the values last seen a decade ago, the actual affordability of a home is much better now. As Chief Economist Mark Fleming explains in the report:

“Though unadjusted house prices have risen to record highs, consumer house-buying power stands at near-historic levels, as well, signaling that real house prices are not even close to their historical peak.”

No Comments

You DO NOT Need 20% Down to Buy Your Home NOW!

You DO NOT Need 20% Down to Buy Your Home NOW! | Simplifying The Market

The Aspiring Home Buyers Profile from the National Association of Realtors (NAR) found that the American public is still somewhat confused about what is required to qualify for a home mortgage loan in today’s housing market. The results of the survey show that the main reason why non-homeowners do not own their own homes is because they believe that they cannot afford them.

This brings us to two major misconceptions that we want to address today.

1. Down Payment

A recent survey by Laurel Road, the National Online Lender and FDIC-Insured Bank, revealed that consumers overestimate the down payment funds needed to qualify for a home loan.

According to the survey, 53% of Americans who plan to buy or have already bought a home admit to their concerns about their ability to afford a home in the current market. In addition, 46% are currently unfamiliar with alternative down payment options, and 46% of millennials do not feel confident that they could currently afford a 20% down payment.

What these people don’t realize, however, is that there are many loans written with down payments of 3% or less.

Many renters may actually be able to enter the housing market sooner than they ever imagined with new programs that have emerged allowing less cash out of pocket.

2. FICO®Scores

An Ipsos survey revealed that 62% of respondents believe they need excellent credit to buy a home, with 43% thinking a “good credit score” is over 780. In actuality, the average FICO® scores for approved conventional and FHA mortgages are much lower.

The average conventional loan closed in May had a credit score of 753, while FHA mortgages closed with an average score of 676. The average across all loans closed in May was 724. The chart below shows the distribution of FICO® Scores for all loans approved in May.

You DO NOT Need 20% Down to Buy Your Home NOW! | Simplifying The Market

Bottom Line

If you are a prospective buyer who is ‘ready’ and ‘willing’ to act now, but you are not sure if you are ‘able’ to, let’s sit down to help you understand your true options today.

No Comments

The Cost of Renting vs. Buying [INFOGRAPHIC]

The Cost of Renting vs. Buying [INFOGRAPHIC] | Simplifying The Market

The Cost of Renting vs. Buying [INFOGRAPHIC] | Simplifying The Market

Some Highlights:

  • Historically, the choice between renting or buying a home has been a tough decision.
  • Looking at the percentage of income needed to rent a median-priced home today (28.8%) vs. the percentage needed to buy a median-priced home (17.1%), the choice becomes obvious.
  • Every market is different. Before you renew your lease again, find out if you can put your housing costs to work by buying this year!
No Comments

Why Home Prices Are Increasing

Why Home Prices Are Increasing | Simplifying The Market

There are many unsubstantiated theories as to why home values are continuing to increase. From those who are worried that lending standards are again becoming too lenient (data shows this is untrue), to those who are concerned that prices are again approaching boom peaks because of “irrational exuberance” (this is also untrue as prices are not at peak levels when they are adjusted for inflation), there seems to be no shortage of opinion.

However, the increase in prices is easily explained by the theory of supply & demand. Whenever there is a limited supply of an item that is in high demand, prices increase.

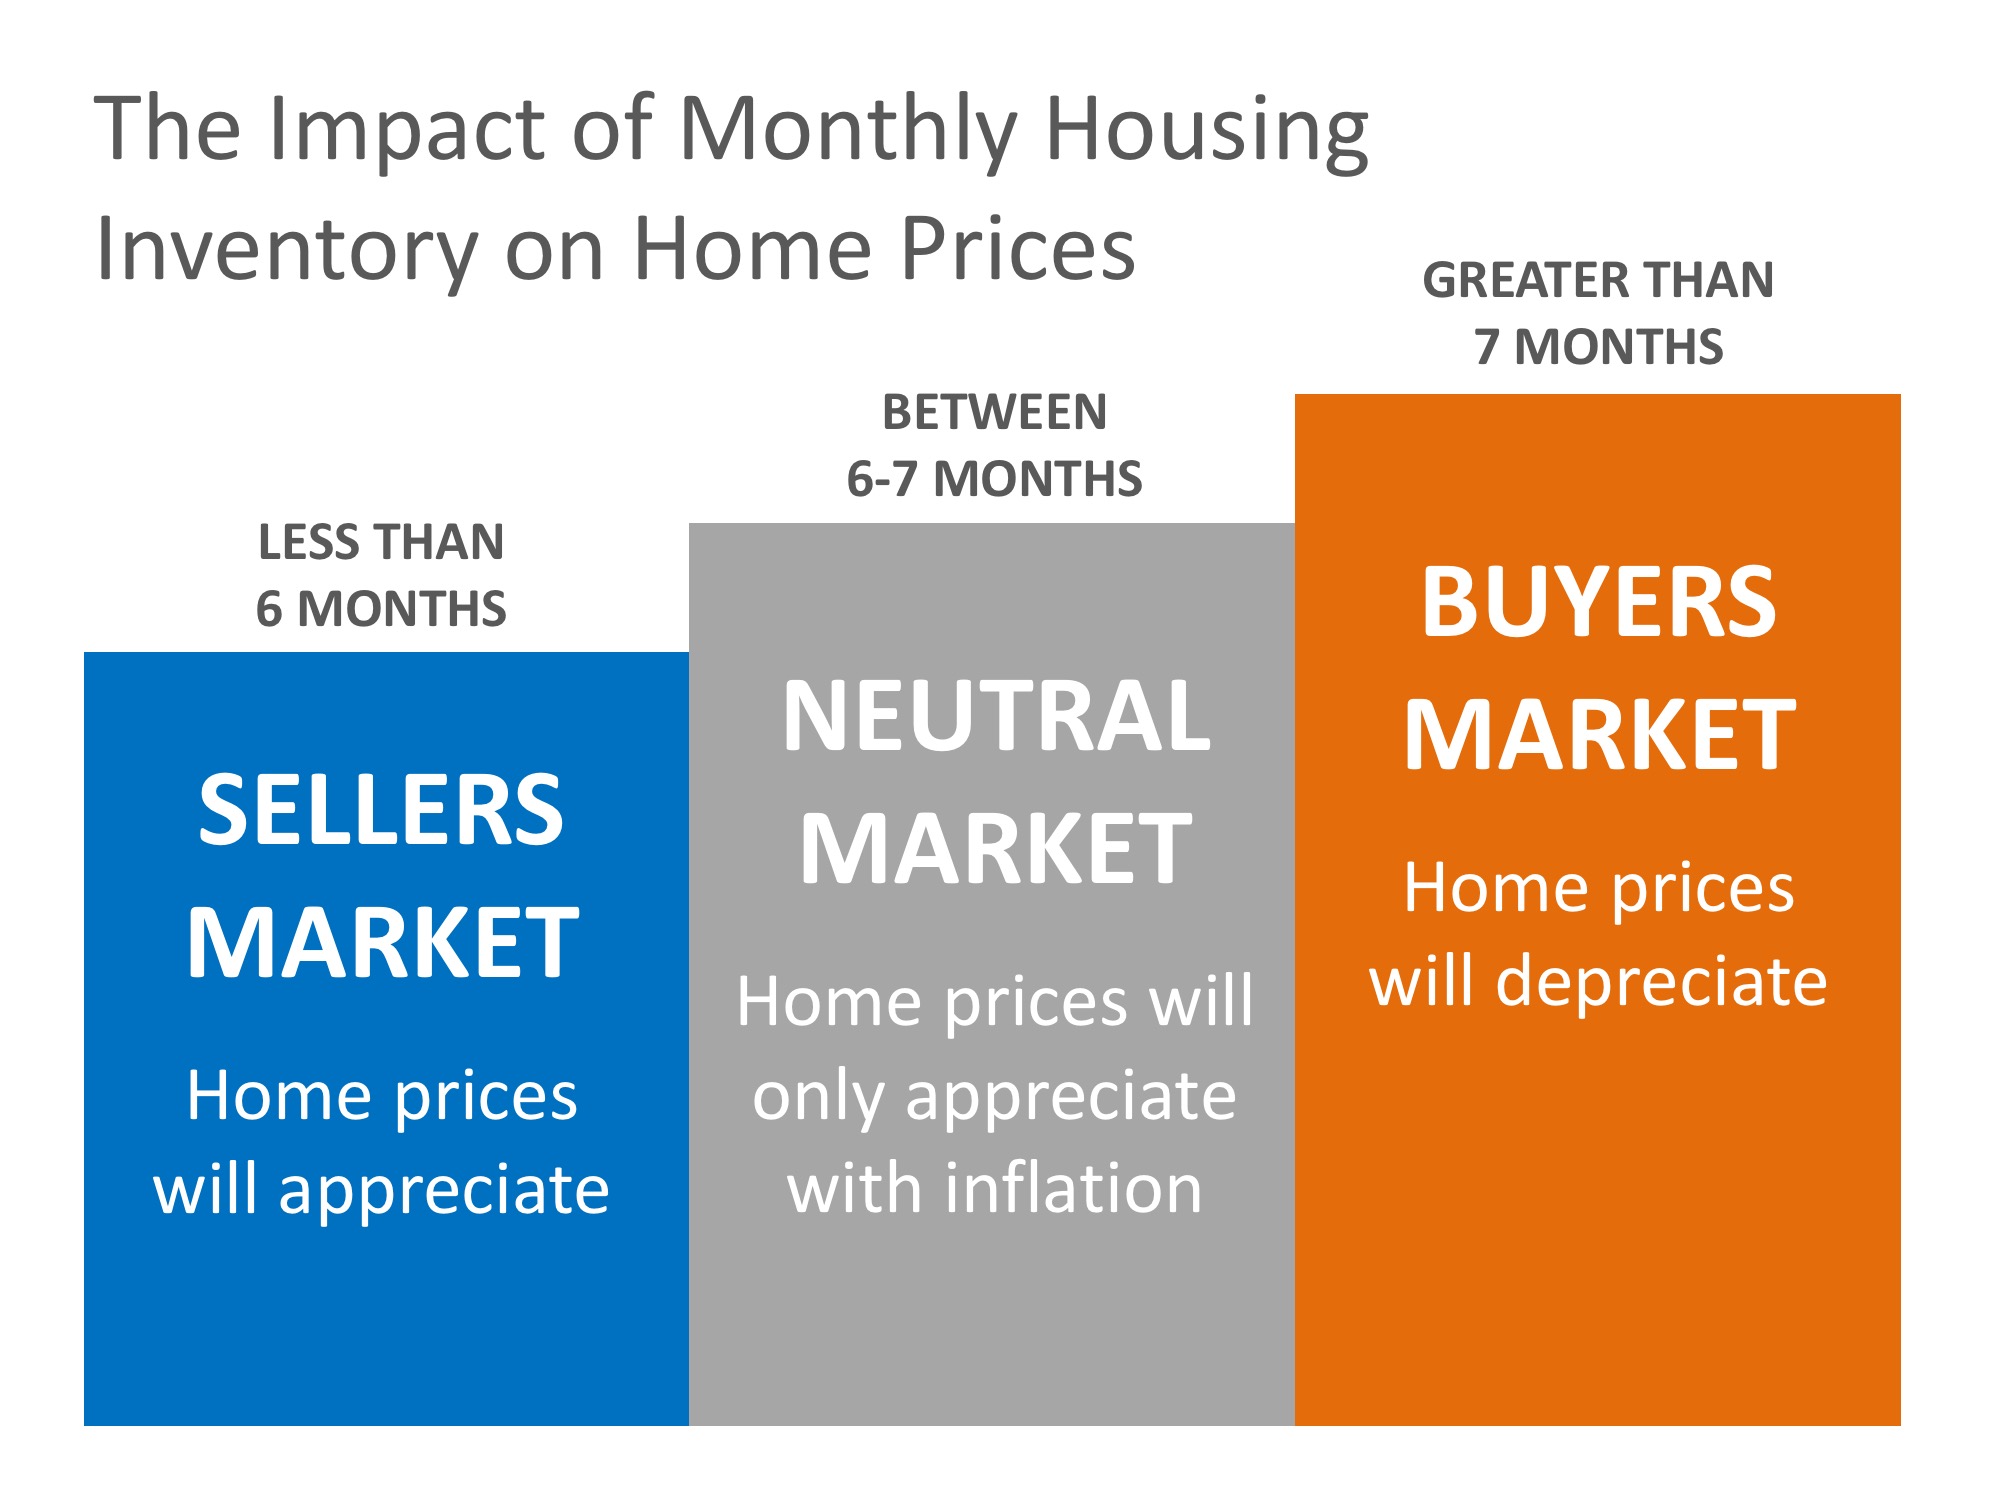
It is that simple. In real estate, it takes a six-month supply of existing salable inventory to maintain pricing stability. In most housing markets, anything less than six months will cause home values to appreciate and anything more than seven months will cause prices to depreciate (see chart below).

Why Home Prices Are Increasing | Simplifying The Market

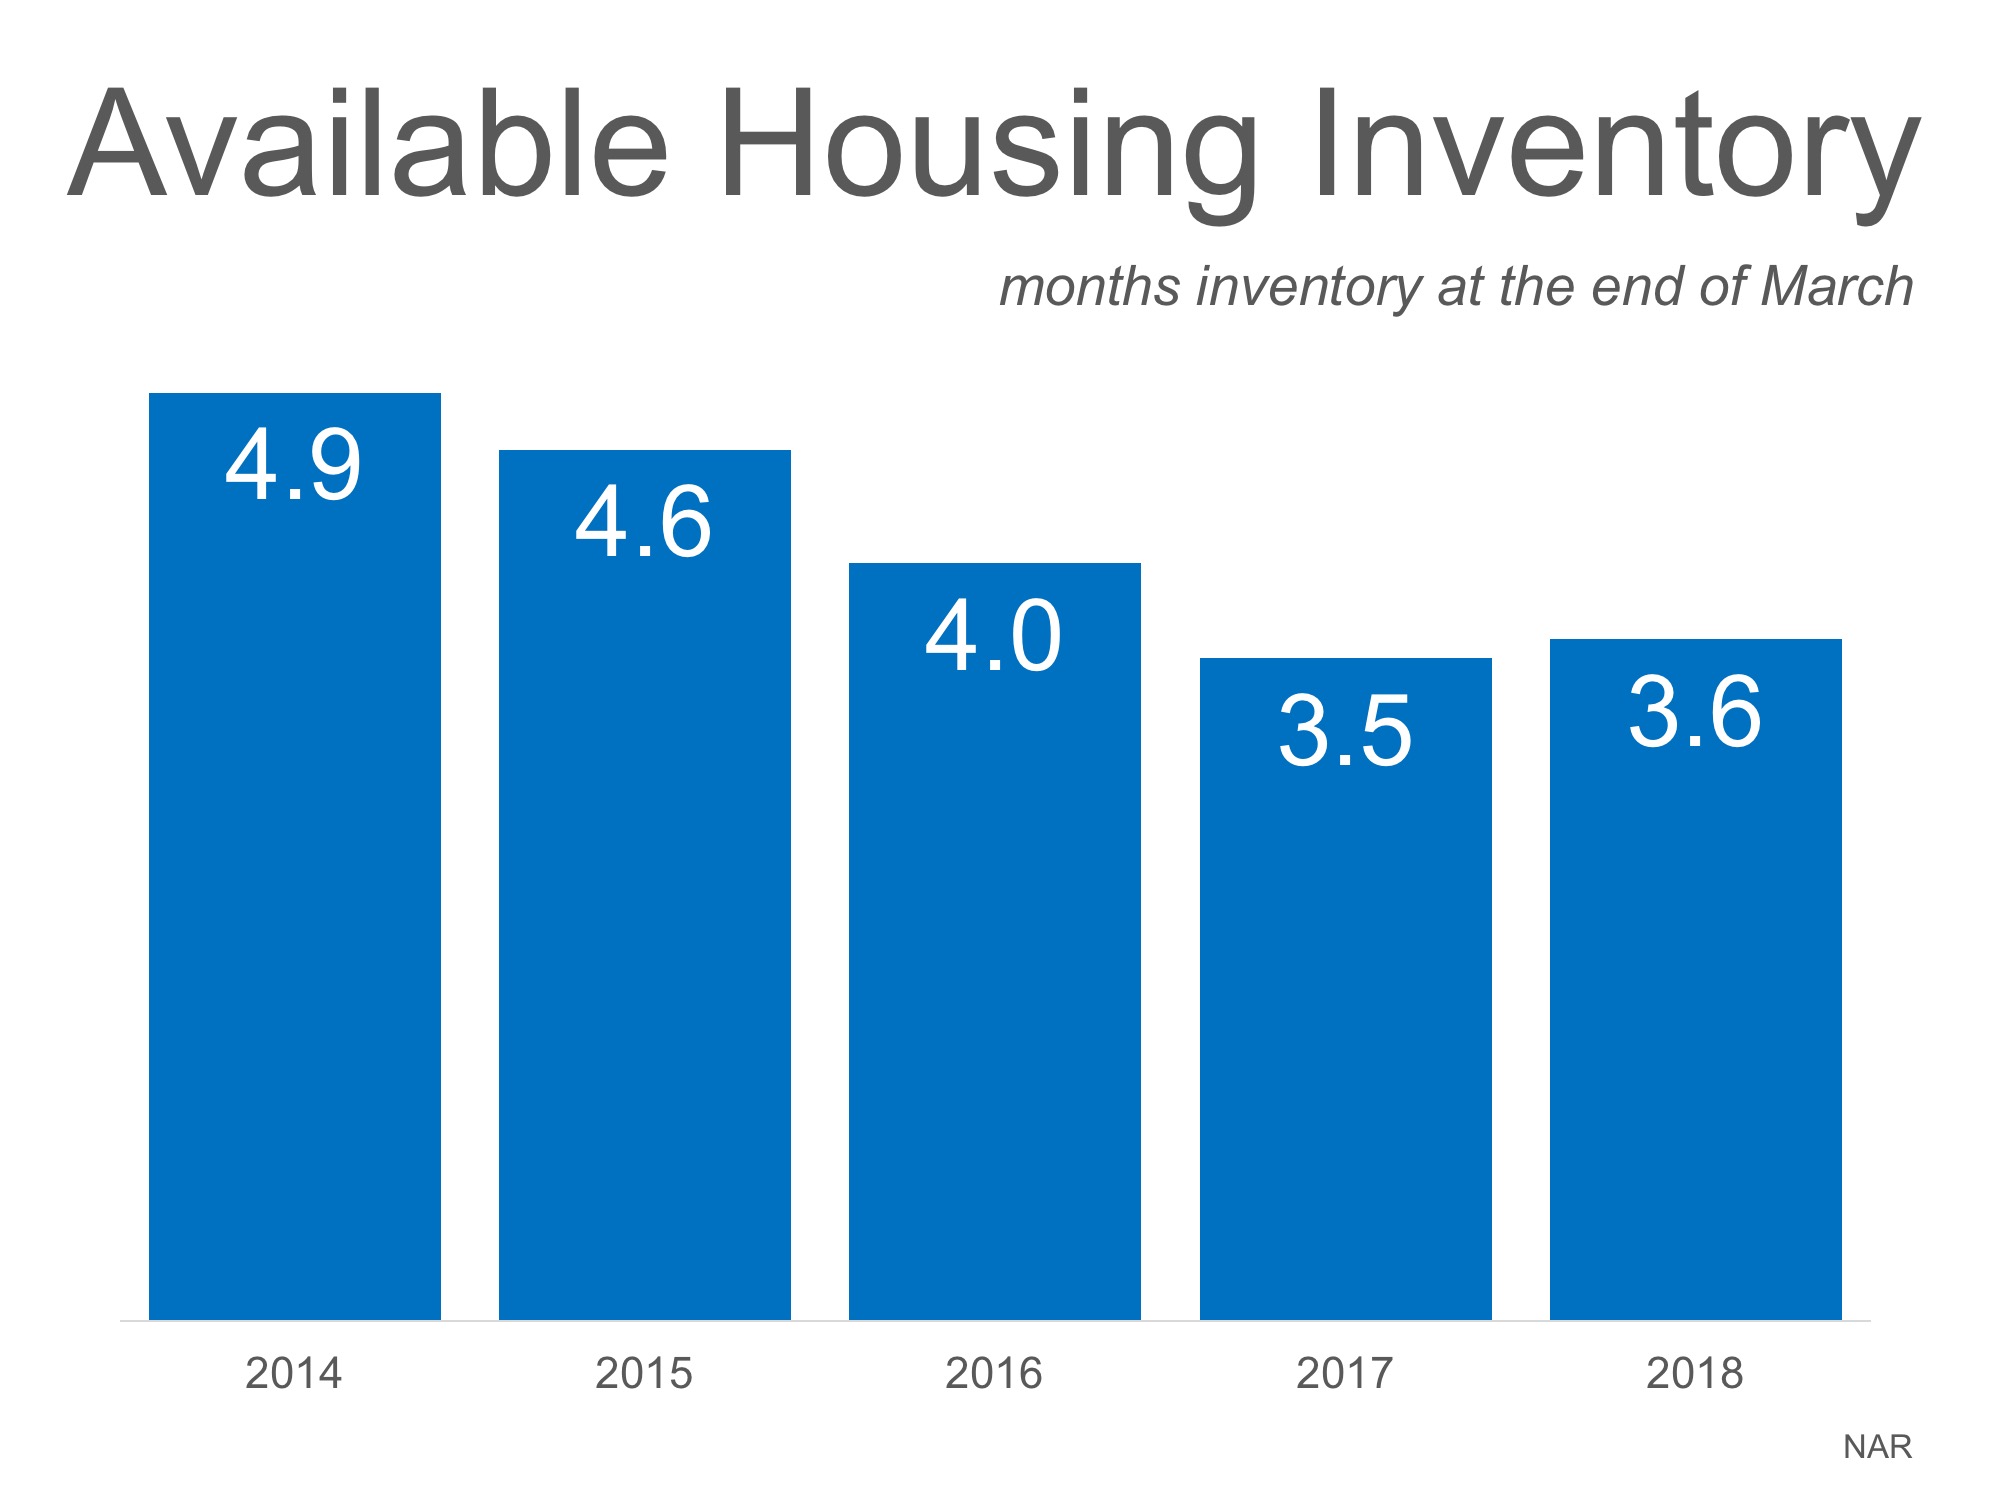
According to the Existing Home Sales Report from the National Association of Realtors (NAR), the monthly inventory of homes for sale has been below six months for the last five years (see chart below).

Why Home Prices Are Increasing | Simplifying The Market

Bottom Line

If buyer demand continues to outpace the current supply of existing homes for sale, prices will continue to appreciate. Nothing nefarious is taking place. It is simply the theory of supply & demand working as it should.