No Comments

5 Ways Tax Reform Has Impacted the 2018 Housing Market

5 Ways Tax Reform Has Impacted the 2018 Housing Market | Simplifying The Market

Starting late last year, some predicted that the 2018 tax changes would cripple the housing market. Headlines warned of the potential for double-digit price depreciation and suggested that buyer demand could drop like a rock. There was even sentiment that homeownership could lose its coveted status as a major component of the American Dream. 

Now that the first quarter numbers are in, we can begin to decipher the actual that impact tax reform has had on the real estate market.

1. Has tax reform killed off home buyer demand? The answer is “NO.”

According to the Showing Time Index which “tracks the average number of buyer showings on active residential properties on a monthly basis” and is a “highly reliable leading indicator of current and future demand trends,” buyer demand has increased each month over the last three months and is HIGHER than it was for the same months last year. Buyer demand is not down. It is up.

2. Have the tax changes affected America’s belief in real estate as a long-term investment? The answer is “NO.”

Two weeks ago, Gallup released its annual survey which asks Americans which asset they believed to be the best long-term investment. The survey revealed:

“More Americans name real estate over several other vehicles for growing wealth as the best long-term investment for the fifth year in a row. Just over a third cite real estate for this, while roughly a quarter name stocks or mutual funds.” 

The survey also showed that the percentage of Americans who believe real estate is the best long-term investment was unchanged from a year ago.

3. Has the homeownership rate been negatively impacted by the tax changes? The answer is “NO.”

Not only did the homeownership rate not crash, it increased when compared to the first quarter of last year according to data released by the Census Bureau.

In her latest Z Report,Ivy Zelman explains that tax reform didn’t hurt the homeownership rate, but instead, enhanced it:

“We have been of the opinion that homeownership is most highly correlated with income and the net effect of tax reform would be a positive, rather than negative catalyst for the homeownership rate. While still in the early innings of tax changes, this has proven to be the case.”

4. Has the upper-end market been crushed by new State and Local Taxes (SALT) limitations? The answer is “NO.”

In the National Association of Realtors latest Existing Home Sales Report it was revealed that:

  • Sales between $500,000 and $750,000 were up 4.5% year-over-year
  • Sales between $750,000 and $1M were up 15.1% year-over-year
  • Sales over $1M were up 17.3% year-over-year

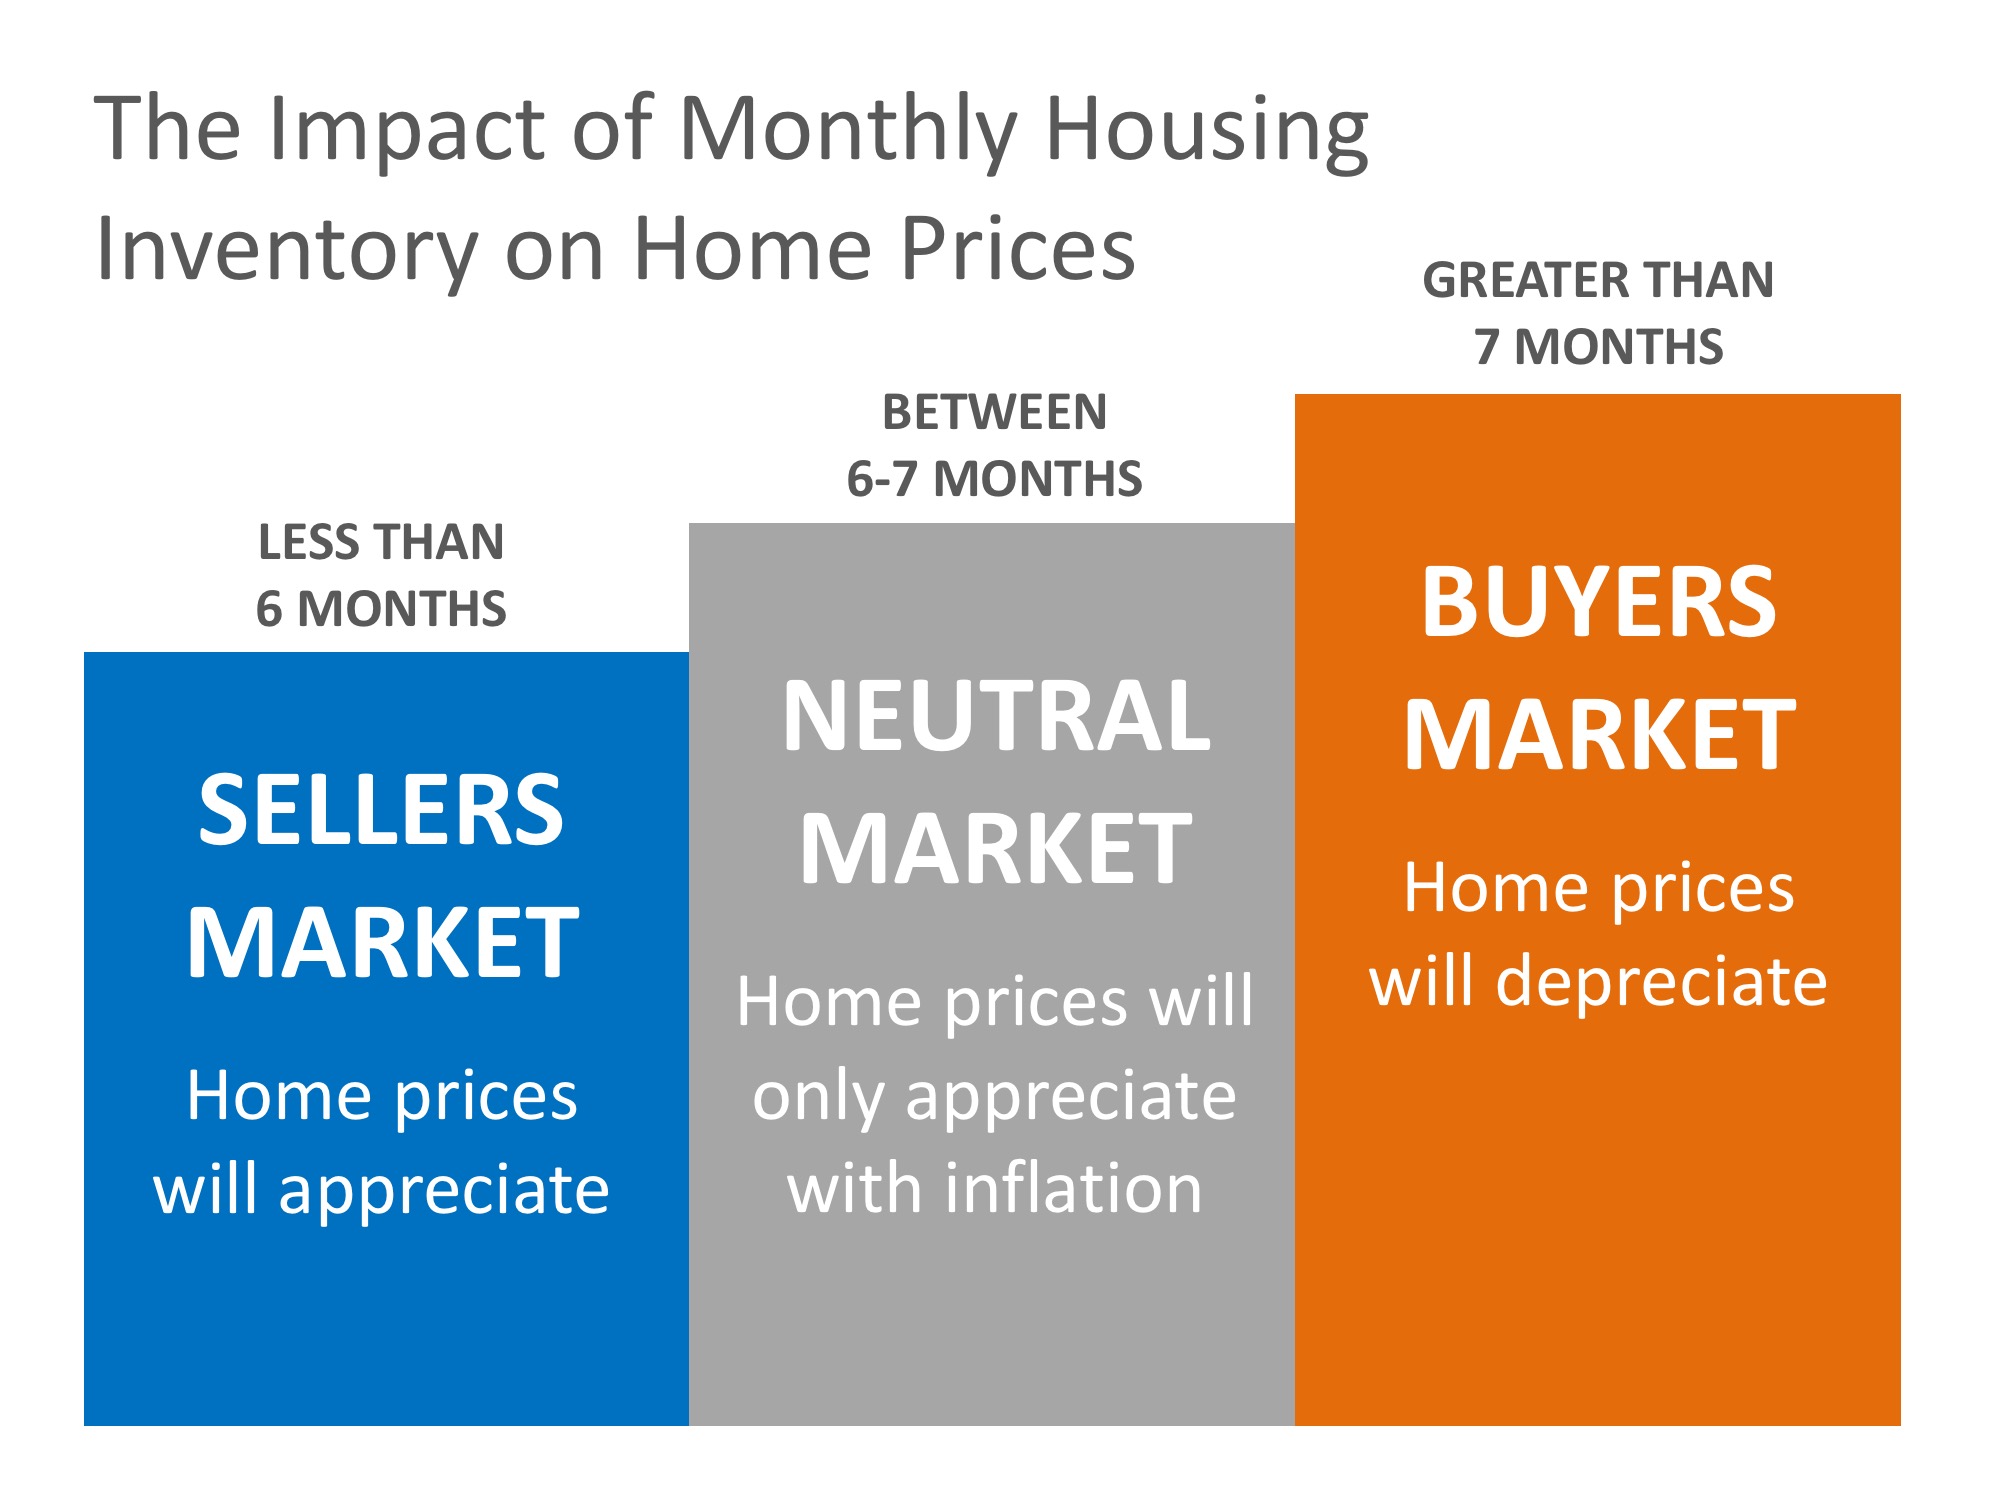
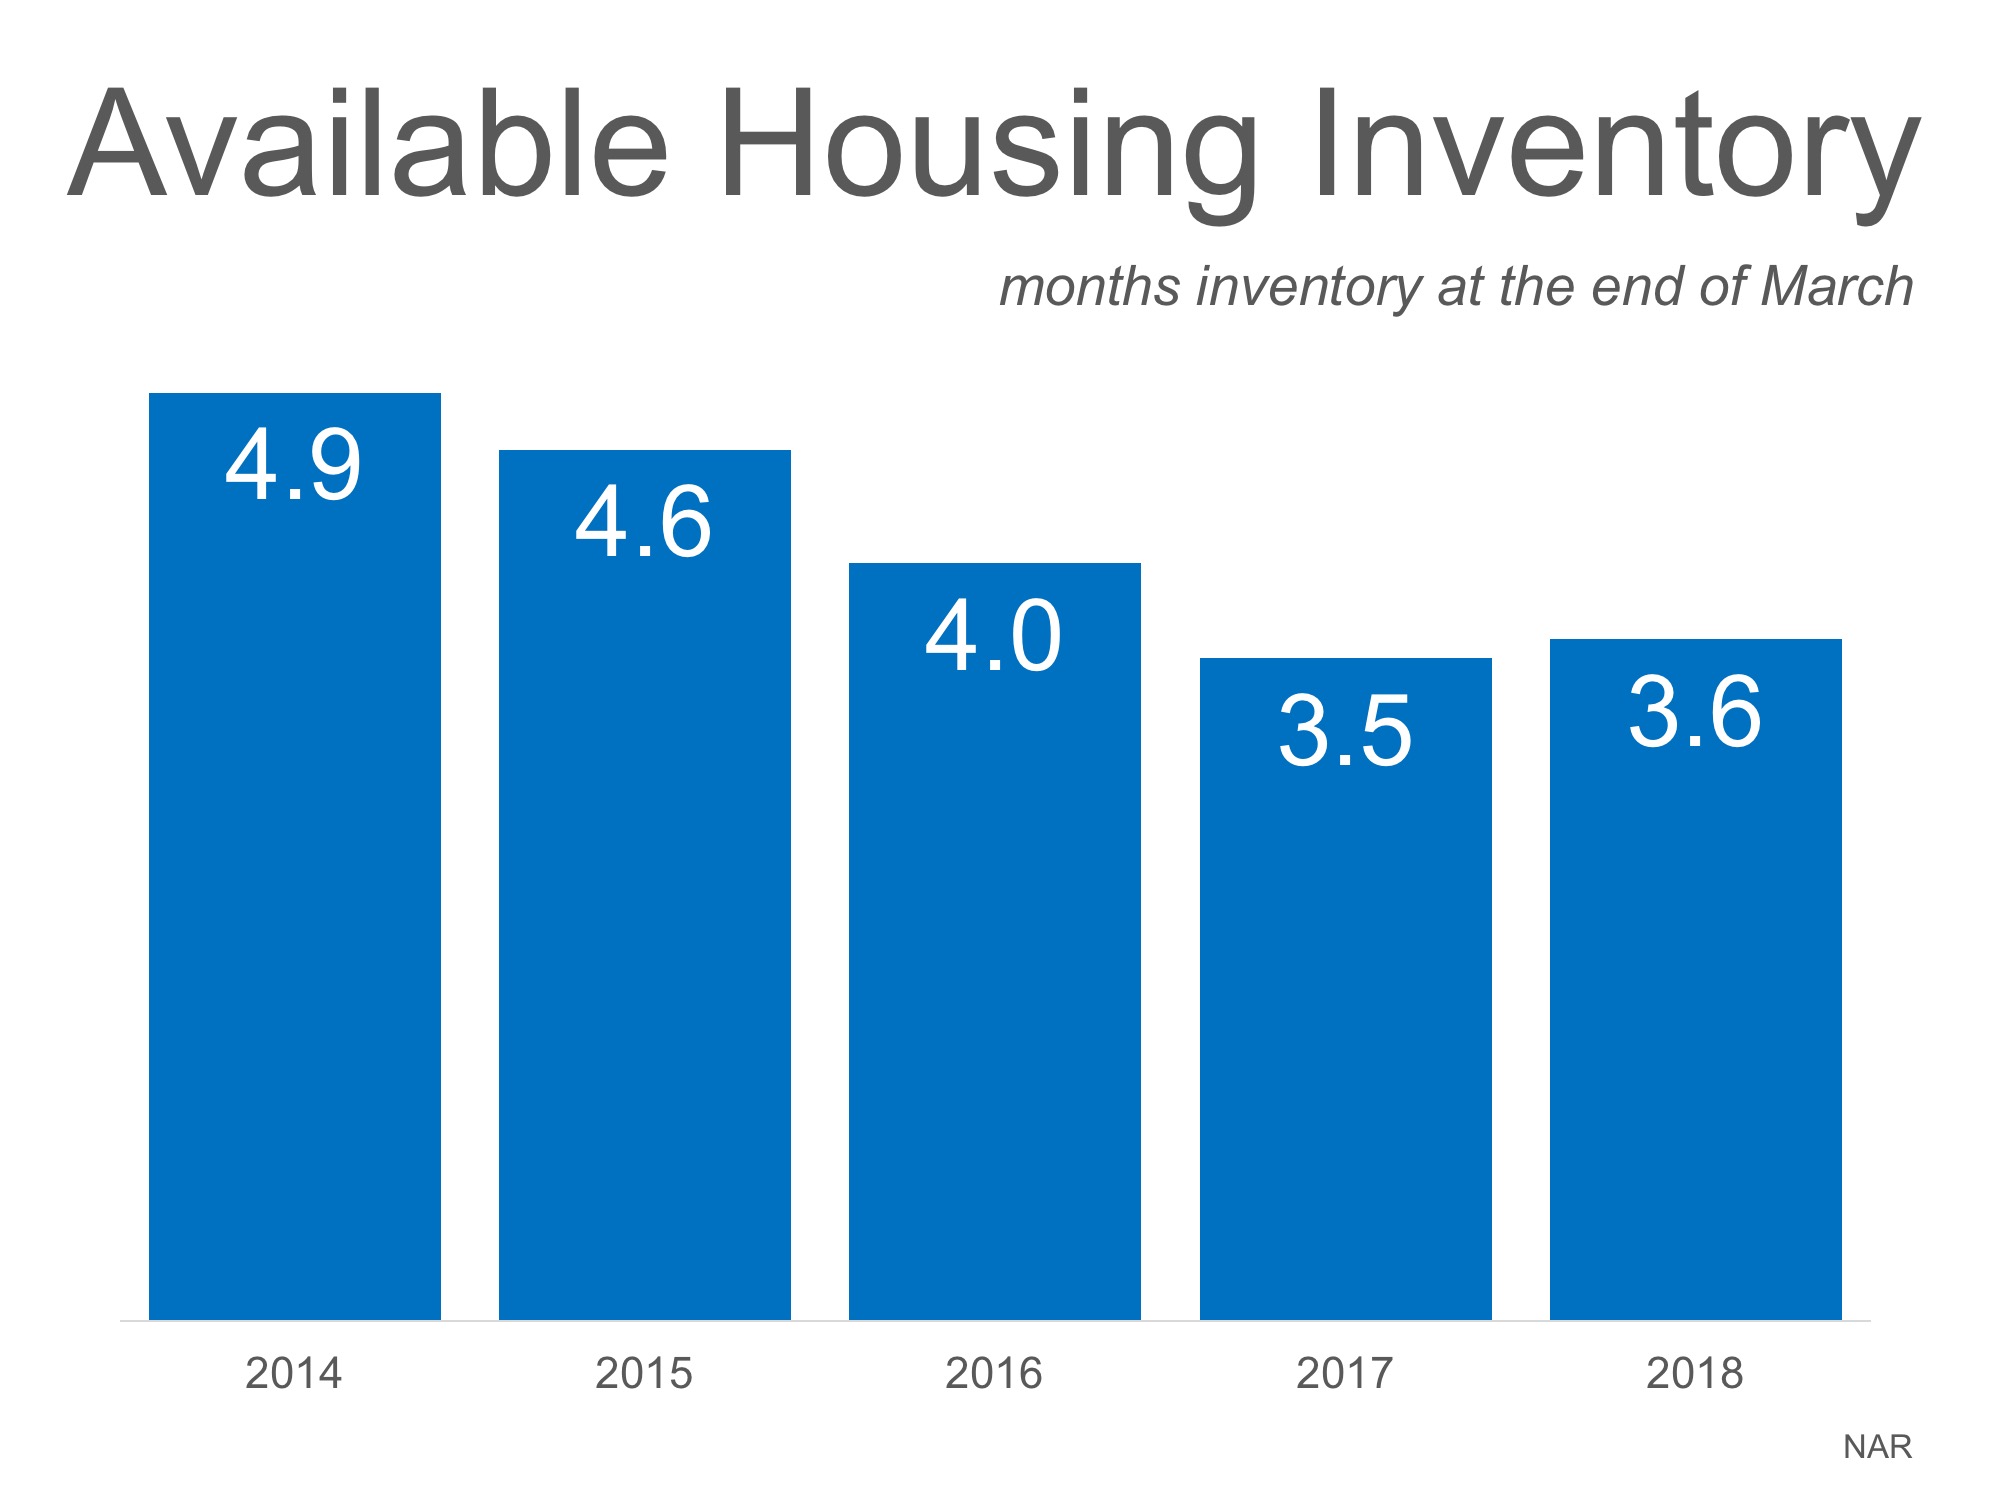
5. Will the reforms in the tax code cause home prices to tumble over the next twelve months? The answer is “NO.”

According to CoreLogic’s latest Home Price Insights Report, home prices will appreciate in each of the 50 states over the next twelve months. Appreciation is projected to be anywhere from 1.9% to 10.3% with the national average being 4.7%.

Bottom Line

The doomsday scenarios that some predicted based on tax reform fears seem to have already blown over based on the early housing industry numbers being reported.

No Comments

Real Estate Tops Best Investment Poll for 5th Year Running

Real Estate Tops Best Investment Poll for 5th Year Running | Simplifying The Market

Every year, Gallup surveys Americans to determine their choice for the best long-term investment. Respondents are given a choice between real estate, stocks/mutual funds, gold, savings accounts/CDs, or bonds.

For the fifth year in a row, real estate has come out on top as the best long-term investment!

This year’s results showed that 34% of Americans chose real estate, followed by stocks at 26%. The full results are shown in the chart below.

Real Estate Tops Best Investment Poll for 5th Year Running | Simplifying The Market

The study makes it a point to draw attention to the contrast in the sentiment over the last five years compared to that of 2011-2012, when gold took the top slot with 34% of the votes. Real estate and stocks took second and third place, respectively, while still in recovery from the Great Recession.

Bottom Line

As the real estate market has recovered, so has the belief of the American people in the stability of housing as a long-term investment.

No Comments

Home Inspections: What to Expect

Home Inspections: What to Expect | Simplifying The Market

So you made an offer, it was accepted, and now your next task is to have the home inspected prior to closing. Oftentimes, agents make your offer contingent on a clean home inspection.

This contingency allows you to renegotiate the price you paid for the home, ask the sellers to cover repairs, or even, in some cases, walk away. Your agent can advise you on the best course of action once the report is filed.

How to Choose an Inspector

Your agent will most likely have a short list of inspectors that they have worked with in the past that they can recommend to you. HGTV recommends that you consider the following 5 areas when choosing the right home inspector for you:

  1. Qualifications – find out what’s included in your inspection and if the age or location of your home may warrant specific certifications or specialties.
  2. Sample Reports – ask for a sample inspection report so you can review how thoroughly they will be inspecting your dream home. The more detailed the report, the better in most cases.
  3. References – do your homework – ask for phone numbers and names of past clients who you can call to ask about their experiences.
  4. Memberships – Not all inspectors belong to a national or state association of home inspectors, and membership in one of these groups should not be the only way to evaluate your choice. Membership in one of these organizations often means that continued training and education are provided.
  5. Errors & Omission Insurance – Find out what the liability of the inspector or inspection company is once the inspection is over. The inspector is only human after all, and it is possible that they might miss something they should have seen.

Ask your inspector if it’s okay for you to tag along during the inspection, that way they can point out anything that should be addressed or fixed.

Don’t be surprised to see your inspector climbing on the roof or crawling around in the attic and on the floors. The job of the inspector is to protect your investment and find any issues with the home, including but not limited to: the roof, plumbing, electrical components, appliances, heating & air conditioning systems, ventilation, windows, the fireplace and chimney, the foundation, and so much more!

Bottom Line

They say ‘ignorance is bliss,’ but not when investing your hard-earned money into a home of your own. Work with a professional who you can trust to give you the most information possible about your new home so that you can make the most educated decision about your purchase.

No Comments

What If I Wait Until Next Year to Buy a Home?

What If I Wait Until Next Year to Buy a Home? | Simplifying The Market

We recently shared that national home prices have increased by 6.7% year-over-year. Over that same time period, interest rates have remained historically low which has allowed many buyers to enter the market.

As a seller, you will likely be most concerned about ‘short-term price’ – where home values are headed over the next six months. As a buyer, however, you must not be concerned about price, but instead about the ‘long-term cost’ of the home.

The Mortgage Bankers Association (MBA), Freddie Mac, and Fannie Mae all project that mortgage interest rates will increase by this time next year. According to CoreLogic’s most recent Home Price Index Report, home prices will appreciate by 5.2% over the next 12 months.

What Does This Mean as a Buyer?

If home prices appreciate by 5.2% over the next twelve months as predicted by CoreLogic, here is a simple demonstration of the impact that an increase in interest rate would have on the mortgage payment of a home selling for approximately $250,000 today:

What If I Wait Until Next Year to Buy a Home? | Simplifying The Market

Bottom Line

If buying a home is in your plan for this year, doing it sooner rather than later could save you thousands of dollars over the terms of your loan.

No Comments

50% of Homes Sold in 30 Days in March [INFOGRAPHIC]

50% of Homes Sold in 30 days in March [INFOGRAPHIC] | Simplifying The Market

Some Highlights:

  • The National Association of REALTORS® recently surveyed their members for their Confidence Index.
  • The REALTORS® Confidence Index is a key indicator of housing market strength based on a monthly survey sent to over 50,000 real estate practitioners. Practitioners are asked about their expectations for home sales, prices and market conditions.
  • Homes sold in less than 60 days in 35 out of 50 states and Washington D.C.
  • Homes typically went under contract in 30 days in March!
No Comments

4 Reasons Why Today’s Housing Market is NOT 2006 All Over Again

4 Reasons Why Today’s Housing Market is NOT 2006 All Over Again | Simplifying The Market

With home prices rising again this year, some are concerned that we may be repeating the 2006 housing bubble that caused families so much pain when it collapsed. Today’s market is quite different than the bubble market of twelve years ago. There are four key metrics that explain why:

  1. Home Prices
  2. Mortgage Standards
  3. Mortgage Debt
  4. Housing Affordability

1. HOME PRICES

There is no doubt that home prices have reached 2006 levels in many markets across the country. However, after more than a decade, home prices should be much higher based on inflation alone.

Frank Nothaft is the Chief Economist for CoreLogic (which compiles some of the best data on past, current, and future home prices). Nothaft recently explained:

“Even though CoreLogic’s national home price index got to the same level it was at the prior peak in April of 2006, once you account for inflation over the ensuing 11.5 years, values are still about 18% below where they were.” (emphasis added)

2. MORTGAGE STANDARDS

Some are concerned that banks are once again easing lending standards to a level similar to the one that helped create the last housing bubble. However, there is proof that today’s standards are nowhere near as lenient as they were leading up to the crash.

The Urban Institute’s Housing Finance Policy Center issues a Housing Credit Availability Index (HCAI). According to the Urban Institute:

“The HCAI measures the percentage of home purchase loans that are likely to default—that is, go unpaid for more than 90 days past their due date. A lower HCAI indicates that lenders are unwilling to tolerate defaults and are imposing tighter lending standards, making it harder to get a loan. A higher HCAI indicates that lenders are willing to tolerate defaults and are taking more risks, making it easier to get a loan.”

The graph below reveals that standards today are much tighter on a borrower’s credit situation and have all but eliminated the riskiest loan products.

4 Reasons Why Today’s Housing Market is NOT 2006 All Over Again | Simplifying The Market

3. MORTGAGE DEBT

Back in 2006, many homeowners mistakenly used their homes as ATMs by withdrawing their equity and spending it with no concern for the ramifications. They overloaded themselves with mortgage debt that they couldn’t (or wouldn’t) repay when prices crashed. That is not occurring today.

The best indicator of mortgage debt is the Federal Reserve Board’s household Debt Service Ratio for mortgages, which calculates mortgage debt as a percentage of disposable personal income.

At the height of the bubble market a decade ago, the ratio stood at 7.21%. That meant over 7% of disposable personal income was being spent on mortgage payments. Today, the ratio stands at 4.48% – the lowest level in 38 years!

4. HOUSING AFFORDABILITY

With both house prices and mortgage rates on the rise, there is concern that many buyers may no longer be able to afford a home. However, when we look at the Housing Affordability Index released by the National Association of Realtors, homes are more affordable now than at any other time since 1985 (except for when prices crashed after the bubble popped in 2008).

4 Reasons Why Today’s Housing Market is NOT 2006 All Over Again | Simplifying The Market

Bottom Line

After using four key housing metrics to compare today to 2006, we can see that the current market is not anything like the bubble market.

No Comments

This Just In: Data Says May is the Best Month to Sell Your Home

According to a newly released study by ATTOM Data Solutions, selling your home in the month of May will net you an average of 5.9% above estimated market value for your home.

For the study, ATTOM performed an “analysis of 14.7 million home sales from 2011 to 2017” and found the average seller premium achieved for each month of the year. Below is a breakdown by month:

This Just In: Data Says May is the Best Month to Sell Your Home | Simplifying The Market

ATTOM even went a step further and broke their results down by day.

Top 5 Days to Sell:

  • June 28th – 9.1% above market
  • February 15th – 9.0% above market
  • May 31st – 8.3% above market
  • May 29th – 8.2% above market
  • June 21st – 8.1% above market

It should come as no surprise that May and June dominate as the top months to sell and that 4 of the top 5 days to sell fall in those two months. The second quarter of the year (April, May, June) is referred to as the Spring Buyers Season, when competition is fierce to find a dream home, which often leads to bidding wars.

One caveat to mention though, is that when broken down by metro, ATTOM noticed that while warmer climates share in the overall trend, it turns out that they have different top months for sales. The best month to get the highest price in Miami, FL, for instance, was January, and Phoenix, AZ came in with November leading the charge.

If you’re thinking of selling your home this year, the time to list is NOW! According to the National Association of Realtors, homes sold in an average of just 30 days last month! If you list now, you’ll have a really good chance to sell in May or June, setting yourself up for getting the best price!

Bottom Line

Let’s get together to discuss the market conditions in our area and get you the most exposure to the buyers who are ready and willing to buy!

No Comments

How Much Has Your Home Increased in Value Over the Last Year?

How Much Has Your Home Increased in Value Over the Last Year? | Simplifying The Market

Home values have risen dramatically over the last twelve months. In CoreLogic’s most recent Home Price Index Report, they revealed that national home prices have increased by 6.7% year-over-year.

CoreLogic broke down appreciation even further into four price ranges, giving us a more detailed view than if we had simply looked at the year-over-year increases in national median home price.

The chart below shows the four price ranges from the report, as well as each one’s year-over-year growth from February 2017 to February 2018 (the latest data available).

How Much Has Your Home Increased in Value Over the Last Year? | Simplifying The Market

It is important to pay attention to how prices are changing in your local market. The location of your home is not the only factor that determines how much your home has appreciated over the course of the last year.

Lower-priced homes have appreciated at greater rates than homes at the upper ends of the spectrum due to demand from first-time home buyers and baby boomers looking to downsize.

Bottom Line

If you are planning to list your home for sale in today’s market, let’s get together to go over exactly what’s going on in your area and your price range.

No Comments

Why Home Prices Are Increasing

Why Home Prices Are Increasing | Simplifying The Market

There are many unsubstantiated theories as to why home values are continuing to increase. From those who are worried that lending standards are again becoming too lenient (data shows this is untrue), to those who are concerned that prices are again approaching boom peaks because of “irrational exuberance” (this is also untrue as prices are not at peak levels when they are adjusted for inflation), there seems to be no shortage of opinion.

However, the increase in prices is easily explained by the theory of supply & demand. Whenever there is a limited supply of an item that is in high demand, prices increase.

It is that simple. In real estate, it takes a six-month supply of existing salable inventory to maintain pricing stability. In most housing markets, anything less than six months will cause home values to appreciate and anything more than seven months will cause prices to depreciate (see chart below).

Why Home Prices Are Increasing | Simplifying The Market

According to the Existing Home Sales Report from the National Association of Realtors (NAR), the monthly inventory of homes for sale has been below six months for the last five years (see chart below).

Why Home Prices Are Increasing | Simplifying The Market

Bottom Line

If buyer demand continues to outpace the current supply of existing homes for sale, prices will continue to appreciate. Nothing nefarious is taking place. It is simply the theory of supply & demand working as it should.

No Comments

Existing Home Sales Grow Despite Low Inventory [INFOGRAPHIC]

Existing Home Sales Grow Despite Low Inventory [INFOGRAPHIC] | Simplifying the Market

Existing Home Sales Grow Despite Low Inventory [INFOGRAPHIC] | Simplifying the Market

Some Highlights:

  • According to the latest Existing Home Sales Report from the National Association of Realtors, sales grew 1.1% in March to an annual pace of 5.60 million.
  • This is the strongest pace since November of 2017.
  • Inventory levels dropped year-over-year for the 34th consecutive month and are now 7.2% lower than March 2017 levels, representing a 3.6-month supply.