No Comments

Seniors Are on the Move in the Real Estate Market

Seniors Are on the Move in the Real Estate Market | Simplifying The Market

Did you know August 21st is National Senior Citizens Day? According to the United States Census, we honor senior citizens today because,

 “Throughout our history, older people have achieved much for our families, our communities, and our country. That remains true today and gives us ample reason…to reserve a special day in honor of the senior citizens who mean so much to our land.

To give proper recognition, we’re going to look at some senior-related data in the housing industry.

According to the Population Reference Bureau,

The number of Americans ages 65 and older is projected to nearly double from 52 million in 2018 to 95 million by 2060, and the 65-and-older age group’s share of the total population will rise from 16 percent to 23 percent.”

Seniors Believe in Homeownership

In a recent report, Freddie Mac compared the homeownership rates of two groups of seniors: the Good Times Cohort (born from 1931-1941) and the Previous Generations (born in the 1930s). The data shows an increase in the homeownership rate for the Good Times Cohort because seniors are now aging in place, living longer, and maintaining a high quality of life into their later years.Seniors Are on the Move in the Real Estate Market | Simplifying The MarketThis, however, does not mean all seniors are staying in place. Some are actively buying and selling homes. In the 2019 Home Buyers and Sellers Generational Trends Report, the National Association of Realtors® (NAR) showed the percentage of seniors buying and selling:Seniors Are on the Move in the Real Estate Market | Simplifying The Market

Here are some highlights from NAR’s report:

  • Buyers ages 54 to 63 had higher median household incomes and were more likely to be married couples.
  • 12% of buyers ages 54 to 63 are first-time homebuyers, 5% (64 to 72), and 4% (73 to 93).
  • Buyers ages 54 to 63 purchased because of an interest in being closer to friends and families, job relocation, and the desire to own a home of their own.
  • Sellers 54 years and older often downsized and purchased a smaller, less expensive home than the one they sold.
  • Sellers ages 64 to 72 lived in their homes for 21 years or more.

Bottom Line

According to NAR’s report, 58% of buyers ages 64 to 72 said they need help from an agent to find the right home. The transition from a current home to a new one is significant to undertake, especially for anyone who has lived in the same house for many years. If you’re a senior thinking about the process, let’s get together to help you make the move as smoothly as possible.

No Comments

Housing Supply Not Keeping Up with Population Increase

Housing Supply Not Keeping Up with Population Increase | Simplifying The Market

Many buyers are wondering where to find houses for sale in today’s market. It’s a true dilemma. We see an increase in buyer demand, but the supply available for purchase isn’t keeping up.

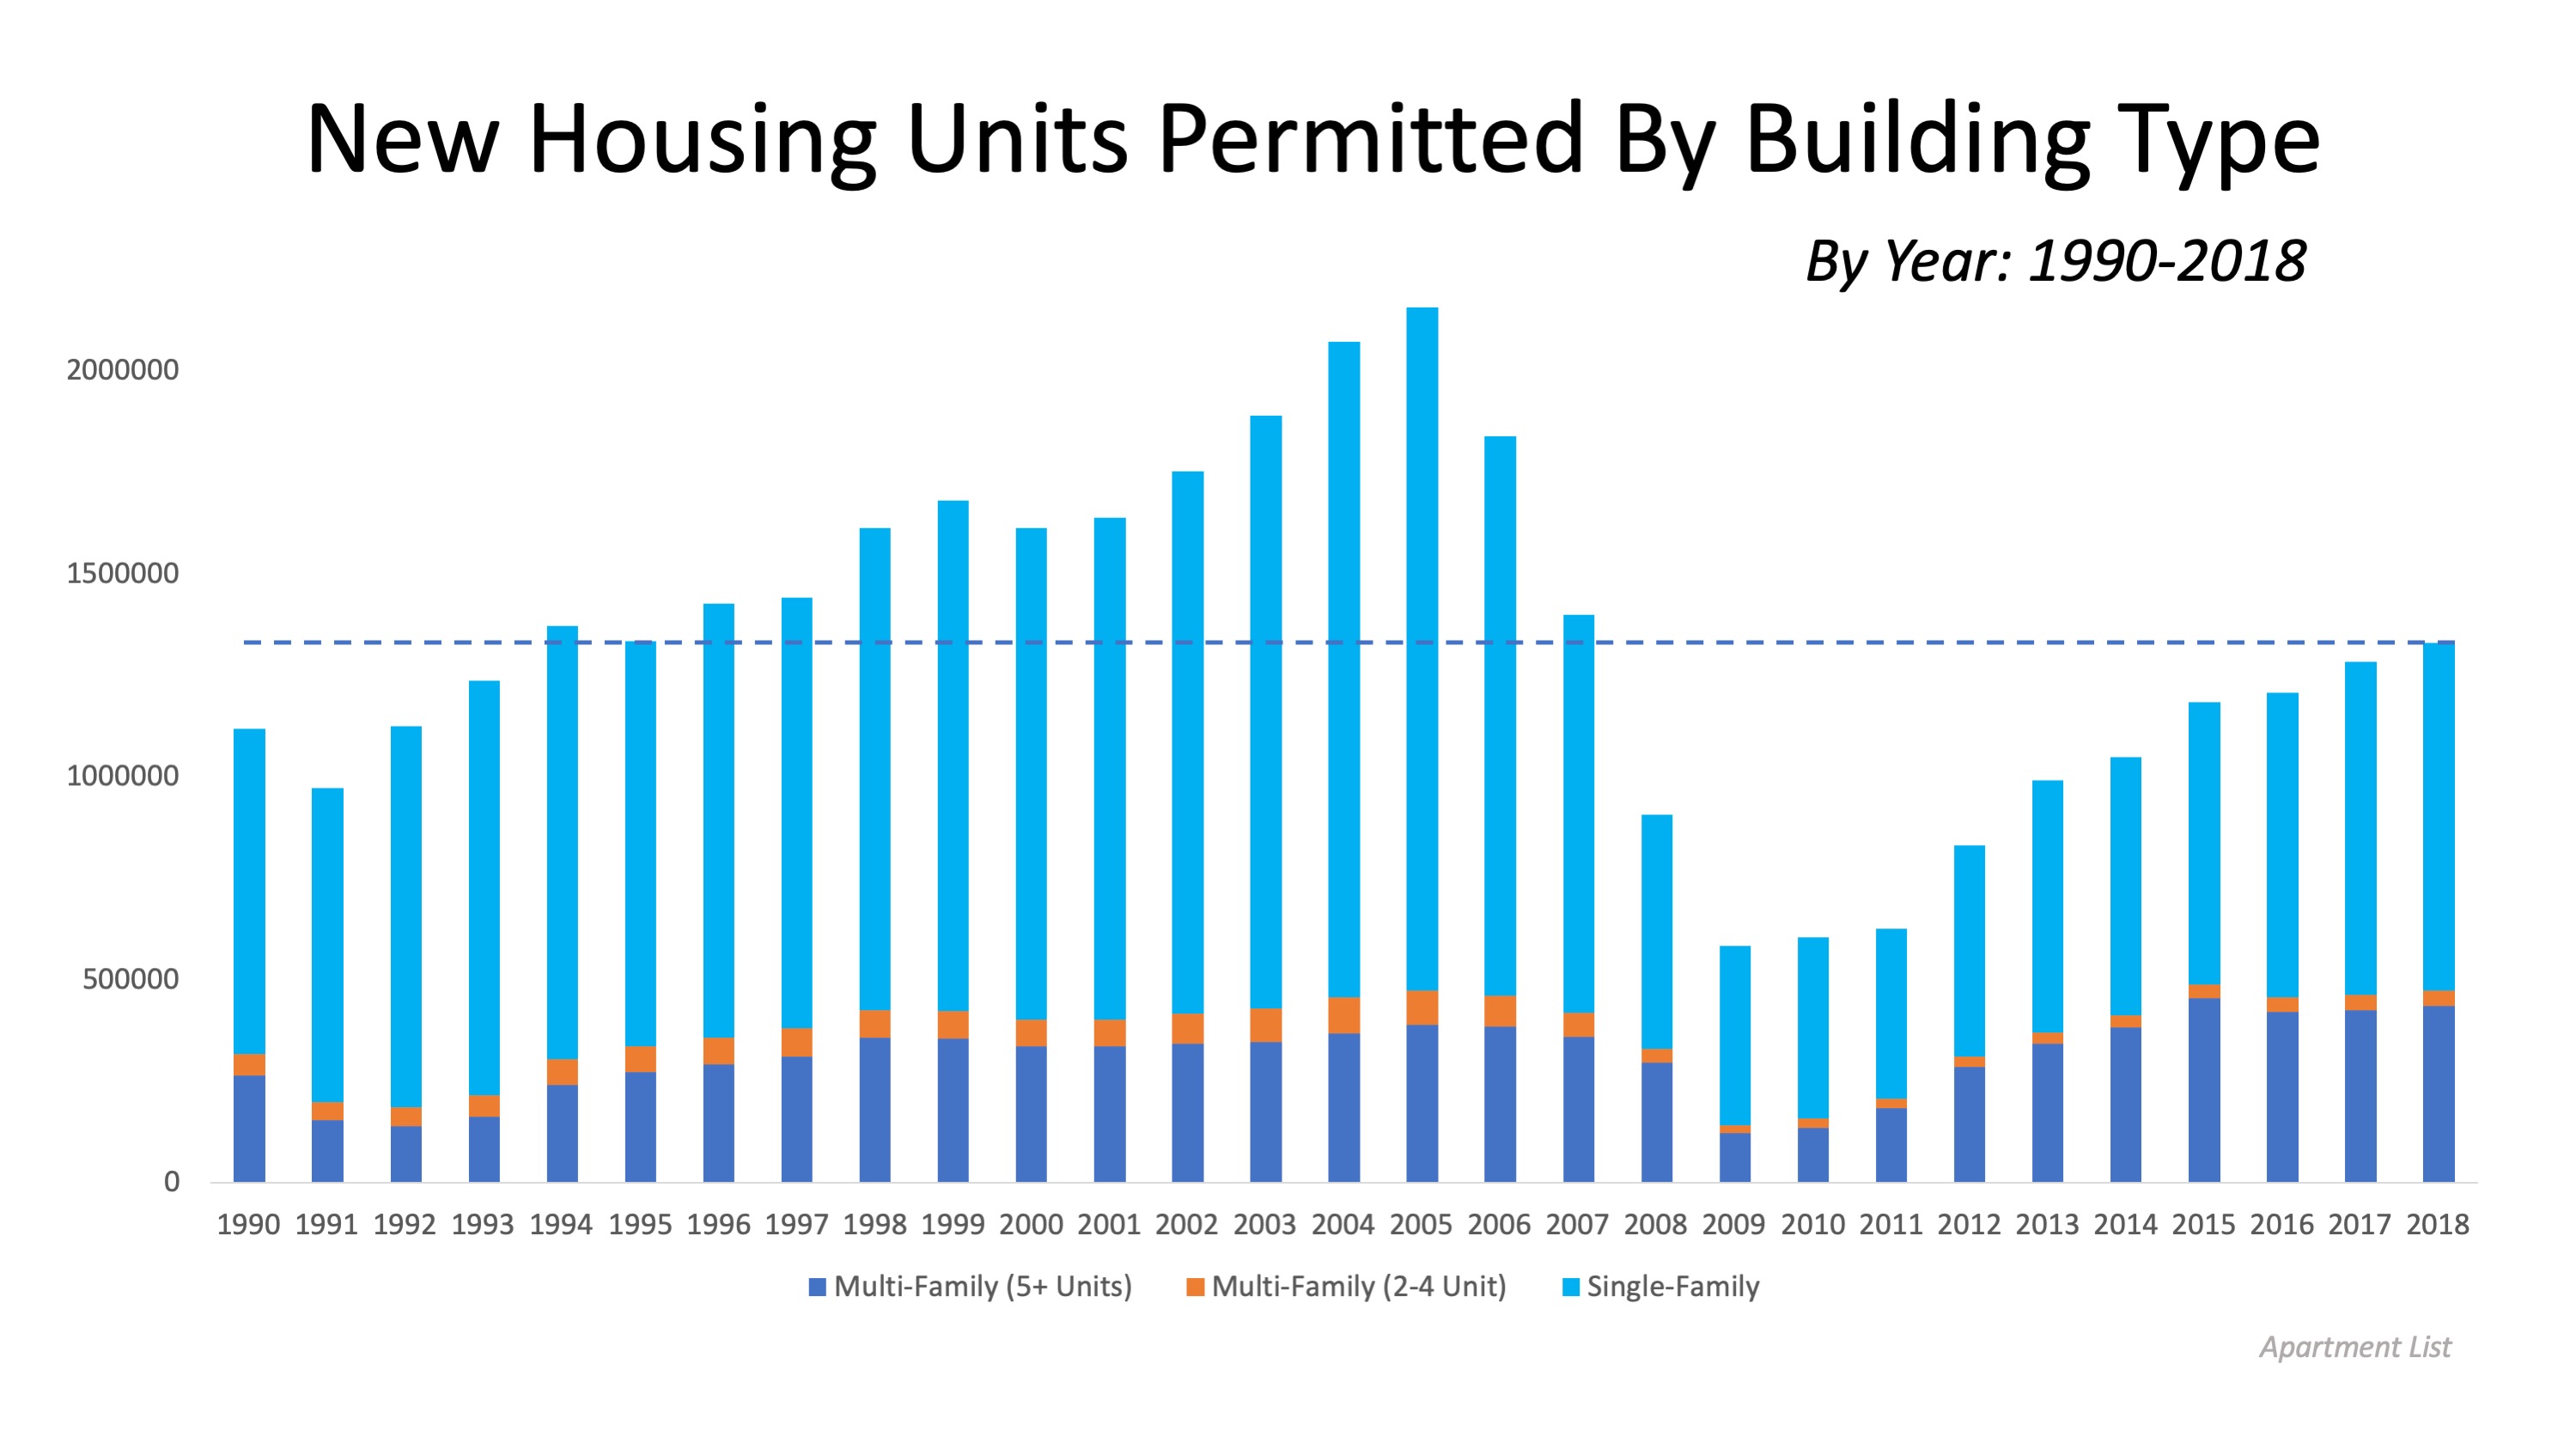
The number of new housing permits issued prior to the great recession increased for 15 years until 2005 (from 1.12 million in 1990 to a pre-recession peak of 2.16 million in 2005). According to Apartment List,

From 1990 to 2005, the number of single-family permits issued more than doubled, while the number of multi-family permits grew by 49 percent.

When the housing market crashed, the number of new homes permitted decreased to its lowest level in 2009 (see below):Housing Supply Not Keeping Up with Population Increase | Simplifying The MarketSince then, supply and demand have been out of balance when it comes to new construction. According to the same report,

Construction of single-family homes has recovered much more slowly — the number of single-family housing units permitted in 2018 was barely half the number permitted in 2005.”

Why is new construction so important?

As the U.S. population increases, there is also an increase in the need for new homes. Today, new construction is not keeping up with the increase in the nation’s population. The report continues:

“The total number of residential housing units permitted in 2018 was roughly the same as the number permitted in 1994, when the country’s population was 20 percent less than it is today.”

Essentially, the dip in home building coupled with the steadily increasing U.S. population means there is now a selling opportunity for homeowners willing to list their current houses.

Bottom Line

If you’re considering selling your home to move up, now is a great time to get a positive return on your investment in a market with high demand. Let’s get together to determine the specific options available for you and your family.

No Comments

A Great Way to Increase Your Family’s Net Worth

A Great Way to Increase Your Family’s Net Worth | Simplifying The Market

Every three years, the Federal Reserve conducts its Survey of Consumer Finances. Data is collected across all economic and social groups. The latest survey data covers 2013-2016.

The study revealed that the median net worth of a homeowner is $231,400 – a 15% increase since 2013. At the same time, the median net worth of renters decreased by 5% ($5,200 today compared to $5,500 in 2013).

These numbers reveal that the net worth of a homeowner is over 44 times greater than that of a renter.

Owning a home is a great way to build family wealth.

As we’ve said before, simply put, homeownership is a form of ‘forced savings.’ Every time you pay your mortgage, you are contributing to your net worth by increasing the equity in your home.

That is why Gallup reported Americans picked real estate as the best long-term investment for the sixth year in a row. According to this year’s results, 35% of Americans chose real estate. Stocks followed at 27%, then savings accounts and gold.

Bottom Line

If you want to find out how you can use your monthly housing cost to increase your family’s wealth, let’s get together to help you through the process.

No Comments

Busting the Myth About a Housing Affordability Crisis

Busting the Myth About a Housing Affordability Crisis | Simplifying The Market

It seems you can’t find a headline with the term “housing affordability” without the word “crisis” attached to it. That’s because some only consider the fact that residential real estate prices have continued to appreciate. However, we must realize it’s not just the price of a home that matters, but the price relative to a purchaser’s buying power.

Homes, in most cases, are purchased with a mortgage. The current mortgage rate is a major component of the affordability equation. Mortgage rates have fallen by over a full percentage point since December 2018. Another major piece of the affordability equation is a buyer’s income. The median family income has risen by 3.5% over the last year.

Let’s look at three different reports issued recently that reveal how homes are very affordable in comparison to historic numbers, and how they have become even more affordable over the past several months.

1. National Association of Realtors’ (NAR) Housing Affordability Index:

Here is a graph showing the index going all the way back to 1990. The higher the column, the more affordable homes are:Busting the Myth About a Housing Affordability Crisis | Simplifying The MarketWe can see that homes are less affordable today (the green bar) than they were during the housing crash (the red bars). This was when distressed properties like foreclosures and short sales saturated the market and sold for massive discounts. However, homes are more affordable today than at any time from 1990 to 2008.

NAR’s report on the index also shows that the percentage of a family’s income needed for a mortgage payment (16.5%) is dramatically lower than last year and is well below the historic norm of 21.2%.Busting the Myth About a Housing Affordability Crisis | Simplifying The Market

2. Black Knight’s Mortgage Monitor:

This report reveals that as a result of falling interest rates and slowing home price appreciation, affordability is the best it has been in 18 months. Black Knight Data & Analytics President Ben Graboske explains:

“For much of the past year and a half, affordability pressures have put a damper on home price appreciation. Indeed, the rate of annual home price growth has declined for 15 consecutive months. More recently, declining 30-year fixed interest rates have helped to ease some of those pressures, improving the affordability outlook considerably…And despite the average home price rising by more than $12K since November, today’s lower fixed interest rates have worked out to a $108 lower monthly payment…Lower rates have also increased the buying power for prospective homebuyers looking to purchase the average-priced home by the equivalent of 15%.”

3. First American’s Real House Price Index:

While affordability has increased recently, Mark Fleming, First American’s Chief Economist explains:

“If the 30-year, fixed-rate mortgage declines just a fraction more, consumer house-buying power would reach its highest level in almost 20 years.”

Fleming goes on to say that the gains in affordability are about mortgage rates and the increase in family incomes:

“Average nominal household incomes are nearly 57 percent higher today than in January 2000. Record income levels combined with mortgage rates near historic lows mean consumer house-buying power is more than 150 percent greater today than it was in January 2000.”

Bottom Line

If you’ve put off the purchase of a first home or a move-up home because of affordability concerns, you should take another look at your ability to purchase in today’s market. You may be pleasantly surprised!

No Comments

The Benefits of Growing Equity in Your Home

The Benefits of Growing Equity in Your Home | Simplifying The Market

Over the last couple of years, we’ve heard quite a bit about rising home prices. Today, expert projections still forecast continued growth, just at a slower pace. One of the often-overlooked benefits of rising home prices is the positive impact they have on home equity. Let’s break down three ways this is a win for homeowners.

1. Move-Up Opportunity

With the rise in prices, homeowners naturally experience an increase in home equity. According to the Homeowner Equity Insights from CoreLogic,

“In the first quarter of 2019, the average homeowner gained approximately $6,400 in equity during the past year.”

This increase in profit means if homeowners decide to sell, they’ll be able to put their equity to work for them as they make plans to move up into their next home.

2. Gain in Seller’s Profit

ATTOM Data Solutions recently released their Q2 2019 Home Sales Report, indicating the seller’s profit jumped at one of the fastest rates since 2015. They said:

“A look at the national numbers showed that U.S. homeowners who sold in the second quarter of 2019 realized an average home price gain since the original purchase of $67,500…the average home seller gain of $67,500 in Q2 2019 represented an average 33.9 percent return as a percentage of the original purchase price.”

Looking at the amount paid when they bought their homes, and then the amount they received after selling, we can see that some homeowners were able to walk away with a significant gain.

3. Out of a Negative Equity Situation

Negative equity occurs when there is a decline in home value, an increase in mortgage debt, or both. Many families experienced these challenges over the last decade. According to the same report from CoreLogic,

“U.S. homeowners with mortgages (roughly 63% of all properties) have seen their equity increase by a total of nearly $485.7 billion since the first quarter 2018, an increase of 5.6%, year over year.

In the first quarter of 2019, the total number of mortgaged residential properties with negative equity decreased…to 2.2 million homes, or 4.1% of all mortgaged properties.”

The good news is, many families have moved beyond a negative equity situation, and no longer owe more on their mortgage than the value of their home.

Bottom Line

If you’re a current homeowner, you may have more equity than you realize. Your equity can open the door to future opportunities, such as moving up to your dream home. Let’s get together to discuss your options and start to put your equity to work for you.

No Comments

American Confidence in Housing at an All-Time High

American Confidence in Housing at an All-Time High | Simplifying The Market

Fannie Mae just released the July edition of their Home Purchase Sentiment Index (HPSI). The HPSI takes information regarding consumers’ confidence in the real estate market from Fannie Mae’s National Housing Survey and condenses it into a single number. Therefore, the HPSI reflects consumers’ current views and forward-looking expectations of housing market conditions.

Great News! The index reached its highest level since Fannie Mae began their survey. Breaking it down, the report revealed:

  • The share of Americans who say it is a good time to buy a home increased from the same time last year.
  • The share of those who say it is a good time to sell a home increased from the same time last year.
  • The share of Americans who say they are not concerned about losing their job over the next 12 months increased dramatically (16 percentage points) from the same time last year.
  • The share of Americans who say mortgage rates will go down over the next 12 months increased dramatically (24 percentage points) from the same time last year.

The day after the index was released, Freddie Mac also announced the 30-year fixed-rate mortgage rate fell to its lowest level in three years.

Doug Duncan, Senior Vice President and Chief Economist at Fannie Mae explained the uptick in the index:

“Consumer job confidence and favorable mortgage rate expectations lifted the HPSI to a new survey high in July, despite ongoing housing supply and affordability challenges. Consumers appear to have shaken off a winter slump in sentiment amid strong income gains. Therefore, sentiment is positioned to take advantage of any supply that comes to market, particularly in the affordable category.”

Bottom Line

Consumers are feeling good about the real estate market. Since Americans are not worried about their jobs, see mortgage rates near an all-time low, and believe it is a good time to buy, the housing market will remain strong for the rest of the year.

No Comments

Why All the Chicken Littles Should Calm Down

Why All the Chicken Littles Should Calm Down | Simplifying The Market

The U.S. Census Bureau recently released their 2019 Q2 Homeownership Report. Some began to see the sky falling, believing the report showed Americans may be stepping back from their belief in homeownership.

The national homeownership rate (Americans who owned vs. rented their primary residence) increased significantly during the housing boom, reaching its peak of 69.2% in 2004. The Census Bureau reported that the second quarter of 2019 ended with a homeownership rate of 64.1%, which is down from the 64.8% rate for the fourth quarter of 2018. Based on this news, some started to question the consumer’s belief in the idea of homeownership as a major part of the American Dream.

Everyone Calm Down…

It is true the homeownership rate did fall. However, if you look at the national rate over the last 35 years (1984-2019), you can see that the current homeownership rate has returned to historical norms. The 64.1% rate is equivalent to the rates in 1984 and 1994.Why All the Chicken Littles Should Calm Down | Simplifying The Market

What Will the Future Bring?

Part of the reason the homeownership rate slipped is a lack of inventory available for purchase for first-time home buyers. The demand is there, but currently, the supply is not. It seems, however, that is about to change.

In a recent report, Ivy Zelman explained that builders have finally started to increase the number of homes they’re constructing at the lower-end price points:

“Robust growth in the entry-level price point of late should translate to a reacceleration in homeownership rates moving forward.”

Bottom Line

Today, the homeownership rate sits at historic norms. In all probability, it will increase as more inventory becomes available. There is no reason for concern.

No Comments

Appreciation Is Strong: It Might Be Time to Sell

Appreciation Is Strong: It Might Be Time to Sell | Simplifying The Market

There’s no doubt that today’s housing market is changing, and everything we see right now indicates it is time to sell. Here’s a look at why selling now is likely to drive the greatest return on your largest investment.

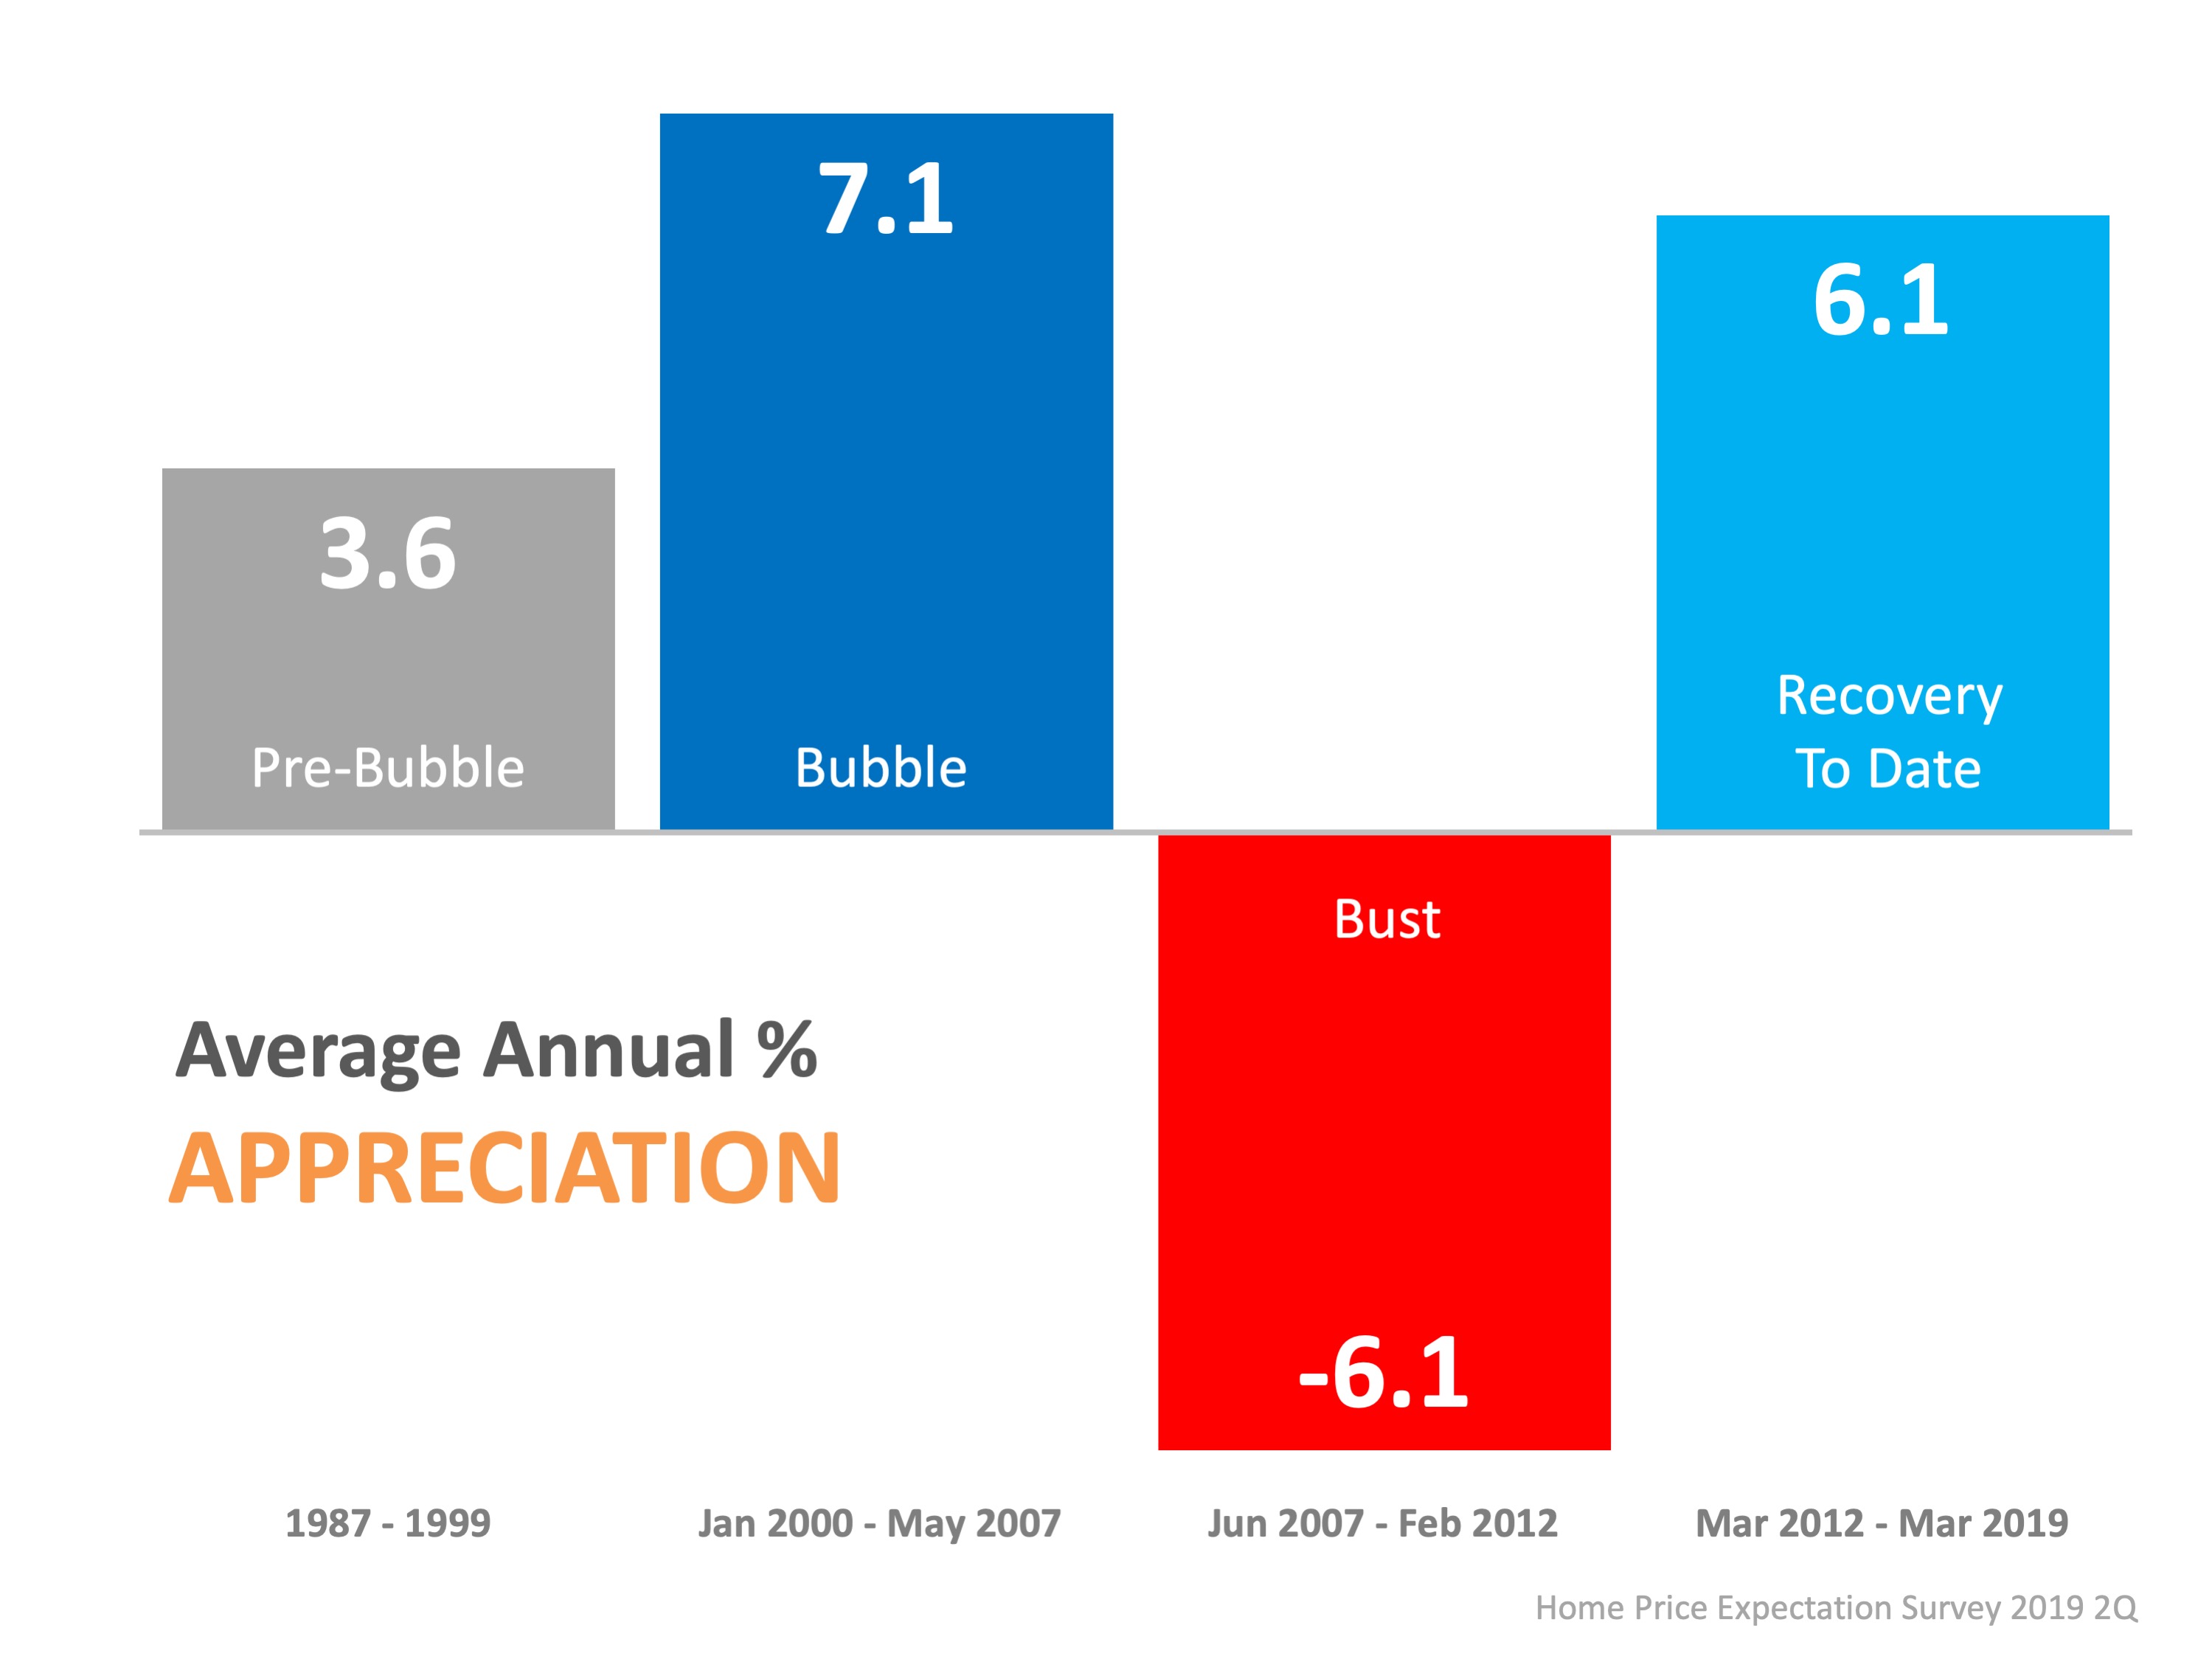
Home values have been appreciating for several years now, growing at a strong, steady, and impressive pace. In fact, the average annual appreciation rate since 2012 has nearly doubled the average rate from the more normal market of the 1990s (think: pre-bubble).Appreciation Is Strong: It Might Be Time to Sell | Simplifying The MarketAppreciation, however, is projected to shift back toward normal, meaning home prices will likely keep climbing over the next few years, but they are not projected to continue to increase at such a high rate.

Here’s What That Means for Homeowners:

As noted in the latest Home Price Expectation Survey (HPES) powered by Pulsenomics, experts forecast an average annual appreciation rate closer to 3.2% over the next five years, which is more in line with a historically normal market (3.6%). The good news is, there’s still time to take advantage of the current strength of home prices by selling your house now.Appreciation Is Strong: It Might Be Time to Sell | Simplifying The MarketLooking at the projections as they stand today, 2019 is slated to drive the strongest appreciation as compared to the upcoming few years. With average home prices still on the rise, the pace at which they are predicted to continue increasing will likely soften by 2020.

Bottom Line

If you’re thinking about selling your house, now is a great time to make your move. Don’t get stuck waiting until projected home price appreciation rates potentially re-accelerate again in 2023. You’ll likely earn the greatest return on your investment by selling now before the prices start to normalize next year.

No Comments

Existing Home Sales Point Toward a Good Time to Sell [INFOGRAPHIC]

Existing Home Sales Point Toward a Good Time to Sell [INFOGRAPHIC] | Simplifying The Market

Existing Home Sales Point Toward a Good Time to Sell [INFOGRAPHIC] | Simplifying The Market

Some Highlights:

  • Existing Home Sales dropped 1.7% from May to a seasonally adjusted annual rate of 5.27 million in June.
  • Low inventory levels are still a factor in the market. The current supply of homes for sale is at 4.4 months, which is less than the optimal 6-month supply.
  • Median home prices were up 4.3% from June 2018, hitting $285,700. This marked the 88th consecutive month with year-over-year price gains.
No Comments

How to Judge the Impact of the Next Economic Slowdown on Housing

How to Judge the Impact of the Next Economic Slowdown on Housing | Simplifying The Market

We’ve experienced economic growth for almost a decade, which is the longest recovery in the nation’s history. Experts know a recession can’t be too far off, but when will this economic slowdown actually occur?

Pulsenomics just released a special report revealing that nearly 6 out of 10 of the 90 economists, investment strategists, and market analysts surveyed believe the next recession will occur by the end of next year. Here’s the breakdown:

  • 9% believe a recession will occur this year
  • 50% believe it will occur in 2020
  • 35% believe it will occur in 2021
  • 6% believe it will occur after 2021

When asked what would trigger the next recession, the three most common responses by those surveyed were:

  1. Trade Policy
  2. Stock Market Correction
  3. Geopolitical Crisis

How might the recession impact real estate?

Challenges in the housing and mortgage markets were major triggers of the last recession. However, a housing slowdown ranked #9 on the list of potential triggers for the next recession, behind such possibilities as fiscal policy and political gridlock.

As far as the impact the recession may have on home values, the experts surveyed indicated home prices would continue to appreciate over the next few years. They called for a 4.1% appreciation rate this year, 2.8% in 2020, and 2.5% in 2021.

Bottom Line

On the same day, in the same survey, the same experts who forecasted a recession happening within the next 18 months also claimed housing will not be the trigger, and home values will still continue to appreciate.